- Discovery Summit 2026: Early User Edition - September 23-24.Register. It's free.
- Graph Builder Toolbar streamlines interactive graphing. Creates shortcuts on Report and GraphBuilder Helpers toolbars. Download and install the extension.
- Subscribe to RSS Feed
- Mark Topic as New
- Mark Topic as Read
- Float this Topic for Current User
- Bookmark
- Subscribe
- Mute
- Printer Friendly Page
Discussions
Solve problems, and share tips and tricks with other JMP users.- User Community
- :
- Discussions
- :
- How to make differential gene expression volcano plot using means difference in ...

- Mark as New
- Bookmark
- Subscribe
- Mute
- Subscribe to RSS Feed
- Get Direct Link
- Report Inappropriate Content
How to make differential gene expression volcano plot using means difference in response screening
Dear experts,
I'm trying to make a differential gene volcano plot showing the means difference with JMP17.2. I used response screening and set a control using the column info, but I couldn't find where to apply the "means difference" option. The graphs I got so far just have FDR logworth by effect size, by Rsqured, or by Slope, I couldn't get FDR logworth by means difference. And the in Result table, I also could not see the "means difference". I followed the JMP Academic: Genomics Research in JMP Pro YouTube, but it didn't show how the means difference was obtained.
Can someone let me know how to solve this issue? Thanks a lot!
Liu
Accepted Solutions


- Mark as New
- Bookmark
- Subscribe
- Mute
- Subscribe to RSS Feed
- Get Direct Link
- Report Inappropriate Content
Re: How to make differential gene expression volcano plot using means difference in response screening
Hi @xliu,
There are two ways to get the Volcano plot and the Mean Differences table to show when using Response Screening from Analyze>Screening>Response Screening:
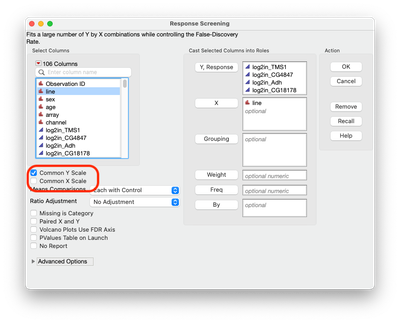
- In the dialog box before running Response Screening, you can check the box Common Y Scale. This assumes that all of the Responses are normalized to the same scale.
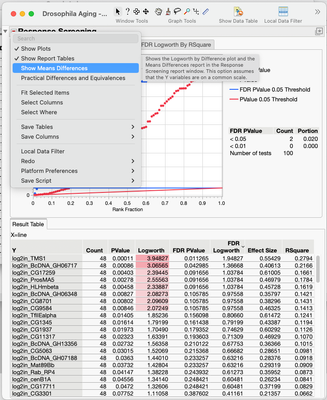
- Go to the Red Triangle in the Report and choose Show Means Differences
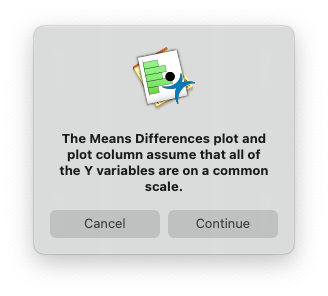
- You will be prompted in a window that looks like below. Click on Continute
You will now have the Volcano plot as the last tab and the means difference table below.
Hope that helps,
Data Scientist, Life Sciences - Global Technical Enablement
JMP Statistical Discovery, LLC. - Denver, CO
Tel: +1-919-531-9927 ▪ Mobile: +1-303-378-7419 ▪ E-mail: [email protected]
www.jmp.com
- Mark as New
- Bookmark
- Subscribe
- Mute
- Subscribe to RSS Feed
- Get Direct Link
- Report Inappropriate Content
Re: How to make differential gene expression volcano plot using means difference in response screening
Hi @xliu,
There are two ways to get the Volcano plot and the Mean Differences table to show when using Response Screening from Analyze>Screening>Response Screening:
- In the dialog box before running Response Screening, you can check the box Common Y Scale. This assumes that all of the Responses are normalized to the same scale.
- Go to the Red Triangle in the Report and choose Show Means Differences
- You will be prompted in a window that looks like below. Click on Continute
You will now have the Volcano plot as the last tab and the means difference table below.
Hope that helps,
Data Scientist, Life Sciences - Global Technical Enablement
JMP Statistical Discovery, LLC. - Denver, CO
Tel: +1-919-531-9927 ▪ Mobile: +1-303-378-7419 ▪ E-mail: [email protected]
www.jmp.com
- Mark as New
- Bookmark
- Subscribe
- Mute
- Subscribe to RSS Feed
- Get Direct Link
- Report Inappropriate Content
Re: How to make differential gene expression volcano plot using means difference in response screening
Hi Chris,
Thanks a lot for the help! It was helpful. I could generate the volcano plot with means difference now.
Thank you!
Liu
Recommended Articles
- © 2026 JMP Statistical Discovery LLC. All Rights Reserved.
- Terms of Use
- Privacy Statement
- Contact Us