- New to JMP? Join us Sept. 23-24 for the Early User Edition of Discovery Summit, tailor-made for new users. Register now for free!
- Your voice matters! Tell us how you prefer to receive JMP updates, so we can tailor our communication to your needs. Take short survey.
- See how to access JMP Marketplace - and - find, create & share add-ins to extend your JMP. Watch video.
- Subscribe to RSS Feed
- Mark Topic as New
- Mark Topic as Read
- Float this Topic for Current User
- Bookmark
- Subscribe
- Mute
- Printer Friendly Page
Discussions
Solve problems, and share tips and tricks with other JMP users.- JMP User Community
- :
- Discussions
- :
- How to export JMP graph to PPT by JSL?

- Mark as New
- Bookmark
- Subscribe
- Mute
- Subscribe to RSS Feed
- Get Direct Link
- Report Inappropriate Content
How to export JMP graph to PPT by JSL?
Accepted Solutions

- Mark as New
- Bookmark
- Subscribe
- Mute
- Subscribe to RSS Feed
- Get Direct Link
- Report Inappropriate Content
Re: How to export JMP graph to PPT by JSL?
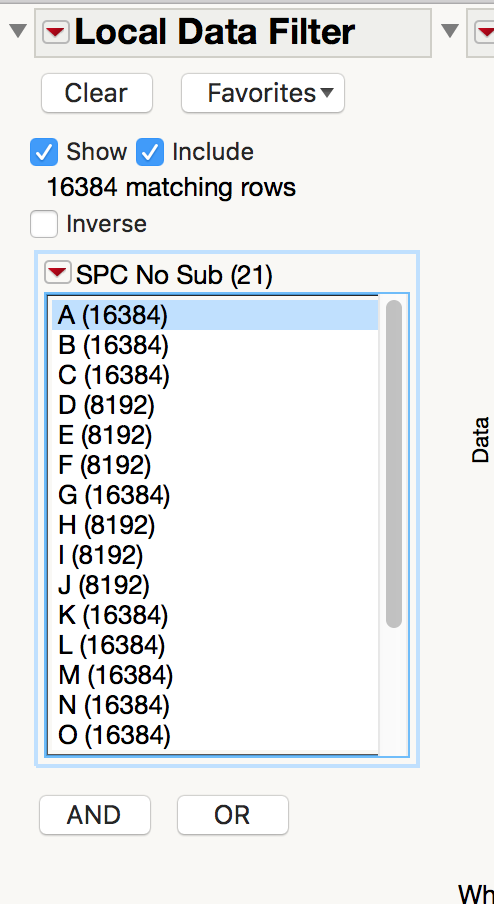
I fully understand what you are requesting. However, sometimes features that are available in JMP that are targeted for interactive usage, do not translate very well to the scripting world. The Local Data Filter is one of them. It is really a fantastic interactive tool, but in the script below, you will see that it's usage in a script, just makes the script more complex. And the interactive feature where the different values that are nicely displayed in the filter list, are not available from the filter when used in JSL.
Here is the script using a scripted local data filter
Names Default To Here( 1 );
dt = Open( "$SAMPLE_DATA\big class.jmp" );
// Get the levels of the Sex column. The Summarize function will
// create a list of the different levels of whatever column is
// specified in the "By" claue
Summarize( dt, GroupBy = By( :Sex ) );
gb = Graph Builder(
	invisible,
	Size( 517, 437 ),
	Show Control Panel( 0 ),
	Variables( X( :age ), Y( :height ) ),
	Elements( Box Plot( X, Y, Legend( 3 ) ) )
);

For( i = 1, i <= N Items( GroupBy ), i++,
	gb << Local Data Filter( Add Filter( columns( :Sex ), Where( :sex == GroupBy[i] ) ), Mode( Show( 1 ), Include( 1 ) ) );
	If( i == 1,
		gb << Save Presentation( "$TEMP/jmp_example2.pptx" ),
		gb << Save Presentation( "$TEMP/jmp_example2.pptx", Append )
	);
	gb << remove data filter;
);

Open( "$TEMP/jmp_example2.pptx" );
Here is the example that I have been using in answering your questions, that does not use the local data filter, and actually gets a better version of the output you want.
Names Default To Here( 1 );
dt = Open( "$SAMPLE_DATA\big class.jmp" );
// Get the levels of the Sex column. The Summarize function will
// create a list of the different levels of whatever column is
// specified in the "By" claue
Summarize( dt, GroupBy = By( :Sex ) );

For( i = 1, i <= N Items( GroupBy ), i++,
	gb = dt << Graph Builder(
	// The invisible option helps to keep the desktop clean
		invisible,
		Size( 517, 437 ),
		Show Control Panel( 0 ),
		Variables( X( :age ), Y( :height ) ),
		Elements( Box Plot( X, Y, Legend( 3 ) ) ),
	// Here is an easy way to subset the data used in the grap
		Where( :sex == GroupBy[i] )
	);
	If(i==1,
		gb << Save Presentation( "$TEMP/jmp_example.pptx"  ),
		gb << Save Presentation( "$TEMP/jmp_example.pptx", Append  );
	);
);

Open( "$TEMP/jmp_example.pptx" );
The second example is much simpler code
- Mark as New
- Bookmark
- Subscribe
- Mute
- Subscribe to RSS Feed
- Get Direct Link
- Report Inappropriate Content
Re: How to export JMP graph to PPT by JSL?
Here is a sample script.
Names Default to Here( 1 );
// The open function below, just need to point to the .xls or .xlsx file you want to open
dt=open("$SAMPLE_DATA\Big Class.jmp");

// Run the Distribution Platform
dis=dt<<Distribution( stack(1),Continuous Distribution( Column( :height ) ),
	// By using the "By" clause you avoid having to play around with
	// the local data filter
	By( :sex ) );
// Write the desired output to the ppt
report(dis[1])["height"]<<save presentation("$TEMP/jmp_example.pptx" );
report(dis[2])["height"]<<save presentation("$TEMP/jmp_example.pptx",append );

// OPen the powerpoint presentation
Open( "$TEMP/jmp_example.pptx" );- Mark as New
- Bookmark
- Subscribe
- Mute
- Subscribe to RSS Feed
- Get Direct Link
- Report Inappropriate Content
Re: How to export JMP graph to PPT by JSL?

- Mark as New
- Bookmark
- Subscribe
- Mute
- Subscribe to RSS Feed
- Get Direct Link
- Report Inappropriate Content
Re: How to export JMP graph to PPT by JSL?
Data Scientist, Life Sciences - Global Technical Enablement
JMP Statistical Discovery, LLC. - Denver, CO
Tel: +1-919-531-9927 ▪ Mobile: +1-303-378-7419 ▪ E-mail: [email protected]
www.jmp.com
- Mark as New
- Bookmark
- Subscribe
- Mute
- Subscribe to RSS Feed
- Get Direct Link
- Report Inappropriate Content
Re: How to export JMP graph to PPT by JSL?
To keep charts from displaying while the code is running, but not having been written to the ppt, the "Invisible" option can be specified within the Platform. I have also added a way to handle your filtering so you can see an easy way to deal with that
I will also point out, that all of these options, etc. are documented and illustrated through examples @:
Help==>Scripting Index
Names Default To Here( 1 );
dt = Open( "$SAMPLE_DATA\big class.jmp" );
gb = dt << Graph Builder(
	// The invisible option helps to keep the desktop clean
	invisible,
	Size( 517, 437 ),
	Show Control Panel( 0 ),
	Variables( X( :age ), Y( :height ) ),
	Elements( Box Plot( X, Y, Legend( 3 ) ) ),
	// Here is an easy way to subset the data used in the grap
	Where( :sex == "F" )
);
New Window( "the graph", myvlb = V List Box() );
myvlb << append( Report( gb ) );- Mark as New
- Bookmark
- Subscribe
- Mute
- Subscribe to RSS Feed
- Get Direct Link
- Report Inappropriate Content
Re: How to export JMP graph to PPT by JSL?
- Mark as New
- Bookmark
- Subscribe
- Mute
- Subscribe to RSS Feed
- Get Direct Link
- Report Inappropriate Content
Re: How to export JMP graph to PPT by JSL?
I fully understand what you are requesting. However, sometimes features that are available in JMP that are targeted for interactive usage, do not translate very well to the scripting world. The Local Data Filter is one of them. It is really a fantastic interactive tool, but in the script below, you will see that it's usage in a script, just makes the script more complex. And the interactive feature where the different values that are nicely displayed in the filter list, are not available from the filter when used in JSL.
Here is the script using a scripted local data filter
Names Default To Here( 1 );
dt = Open( "$SAMPLE_DATA\big class.jmp" );
// Get the levels of the Sex column. The Summarize function will
// create a list of the different levels of whatever column is
// specified in the "By" claue
Summarize( dt, GroupBy = By( :Sex ) );
gb = Graph Builder(
	invisible,
	Size( 517, 437 ),
	Show Control Panel( 0 ),
	Variables( X( :age ), Y( :height ) ),
	Elements( Box Plot( X, Y, Legend( 3 ) ) )
);

For( i = 1, i <= N Items( GroupBy ), i++,
	gb << Local Data Filter( Add Filter( columns( :Sex ), Where( :sex == GroupBy[i] ) ), Mode( Show( 1 ), Include( 1 ) ) );
	If( i == 1,
		gb << Save Presentation( "$TEMP/jmp_example2.pptx" ),
		gb << Save Presentation( "$TEMP/jmp_example2.pptx", Append )
	);
	gb << remove data filter;
);

Open( "$TEMP/jmp_example2.pptx" );
Here is the example that I have been using in answering your questions, that does not use the local data filter, and actually gets a better version of the output you want.
Names Default To Here( 1 );
dt = Open( "$SAMPLE_DATA\big class.jmp" );
// Get the levels of the Sex column. The Summarize function will
// create a list of the different levels of whatever column is
// specified in the "By" claue
Summarize( dt, GroupBy = By( :Sex ) );

For( i = 1, i <= N Items( GroupBy ), i++,
	gb = dt << Graph Builder(
	// The invisible option helps to keep the desktop clean
		invisible,
		Size( 517, 437 ),
		Show Control Panel( 0 ),
		Variables( X( :age ), Y( :height ) ),
		Elements( Box Plot( X, Y, Legend( 3 ) ) ),
	// Here is an easy way to subset the data used in the grap
		Where( :sex == GroupBy[i] )
	);
	If(i==1,
		gb << Save Presentation( "$TEMP/jmp_example.pptx"  ),
		gb << Save Presentation( "$TEMP/jmp_example.pptx", Append  );
	);
);

Open( "$TEMP/jmp_example.pptx" );
The second example is much simpler code

- Mark as New
- Bookmark
- Subscribe
- Mute
- Subscribe to RSS Feed
- Get Direct Link
- Report Inappropriate Content
Re: How to export JMP graph to PPT by JSL?
May i ask, if there is option to use custome ppt template. where we can add multiple graphs in one slide if we have a template?
Recommended Articles
- © 2026 JMP Statistical Discovery LLC. All Rights Reserved.
- Terms of Use
- Privacy Statement
- Contact Us