cancel
Showing results for 
Show  only  | Search instead for 
Did you mean: 
  • Due to the recently reported Microsoft outage, users may be temporarily unable to access My JMP or experience a delay receiving their verification codes. If you have previously installed JMP on your computer, this outage should not impact your ability to access the software. My JMP services will be restored as soon as Microsoft resolves this issue.
  • Image to Table JMP extension imports single or batch images as data tables. Useful to extract curves from pictures or convert image data to curve data to use in analyses like Functional Data Explorer. Download and install the extension.

Discussions

Solve problems, and share tips and tricks with other JMP users.
Choose Language Hide Translation Bar
PhamBao
Level IV

How to detect outliers

Hi all,


I would like to make a script to detect outliers based on my data population.

Based on the image below, I tried to calculate mean of all pockets from 0 to 6 and applied method ((Mean +- (3*sigma)) to find outliers. By direct observation, Pocket 2 has a lot of outliers. However, in case the value of variation data points on Pocket2 is within ((Mean+-(3*sigma)), my method cannot detect them as outliers. 
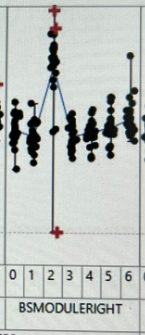
PhamBao_0-1651159157291.png


If I use method ((Mean +-(2*sigma)) to detect outliers, it is too sensitive for other cases.

Does anyone have any advice for me

Sincerely,

1 REPLY 1
jthi
Super User

Re: How to detect outliers

Recommended Articles