- New to JMP? Let the Data Analysis Director guide you through selecting an analysis task, an analysis goal, and a data type. Available now in the JMP Marketplace!
- See how to install JMP Marketplace extensions to customize and enhance JMP.
- Subscribe to RSS Feed
- Mark Topic as New
- Mark Topic as Read
- Float this Topic for Current User
- Bookmark
- Subscribe
- Mute
- Printer Friendly Page
Discussions
Solve problems, and share tips and tricks with other JMP users.- JMP User Community
- :
- Discussions
- :
- Re: How to create stable wafer maps indicating the flat

- Mark as New
- Bookmark
- Subscribe
- Mute
- Subscribe to RSS Feed
- Get Direct Link
- Report Inappropriate Content
How to create stable wafer maps indicating the flat
Hi,
I am triying to create a wafer map and indicate the position of the flat.
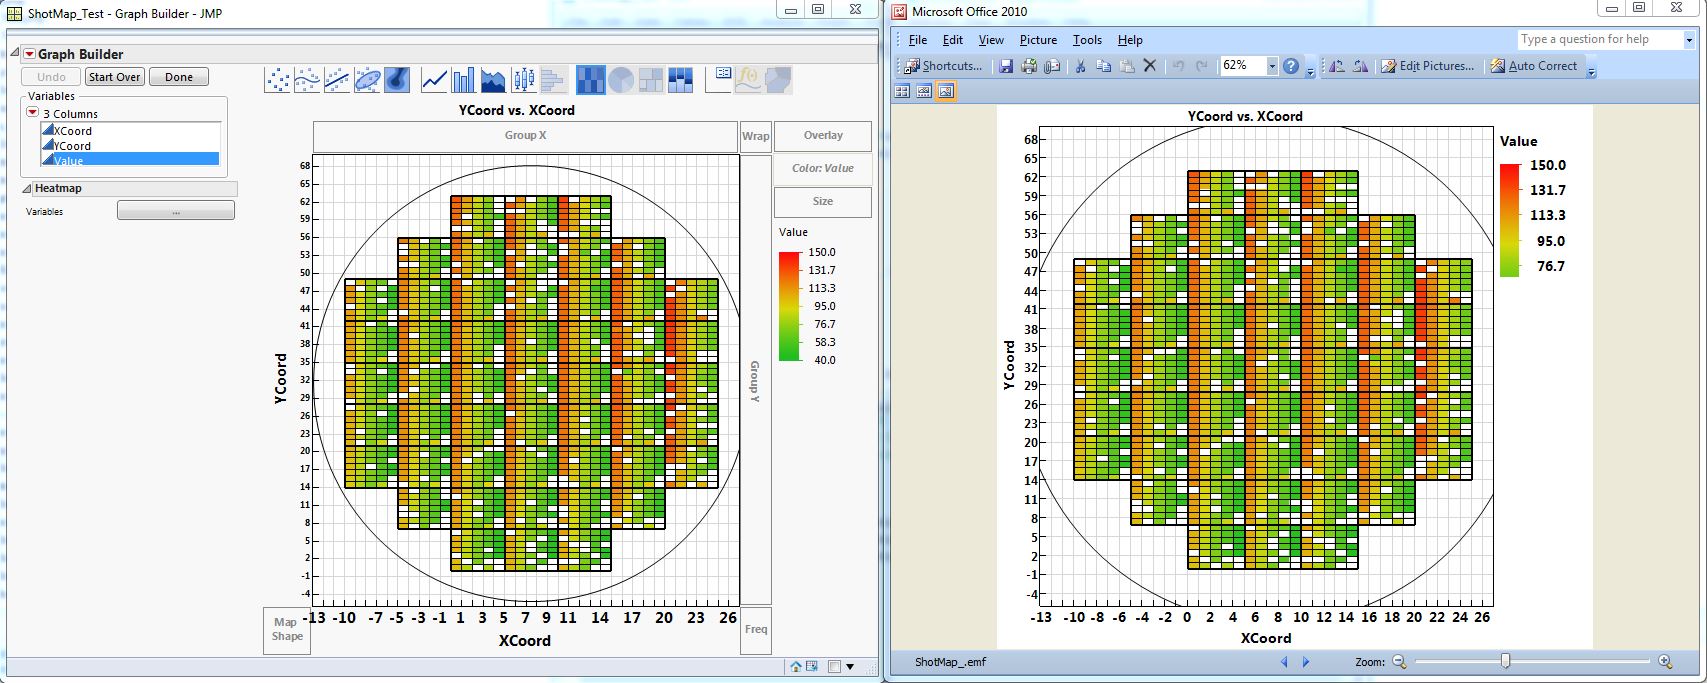
I managed to create the map but using the function "Path" to create the wafer borders was not successful...So I tried to use the function "Circle" and cut it where the flat should be.
The outcome is shown in the right picture below.
There 2 instabilities:
1/ the circle seems to scale differently from the window itself !
2/ When I try to save the picture using the "save picture" function, the wafer borders shift (see left picture below) !
My questions:
1/ Is there a way to have the wafer border including the flat in a simple and stable way when saving the picture ?
2/ Is it also possible to have it tied to the XCoord and Ycoord ? (meaning stable towards window scaling ?).
Please find attached the data table (ShotMap_Test.jmp) and the table needed to create the map (WaferMap.jmp).
Attached also the script I used (it is also attached to the data table)
Many thanks in advance.
dt = Open( "ShotMap_Test.jmp" );

Biv = dt << Graph Builder(
	Size( 511, 557 ),
	Variables( X( :XCoord ), Y( :YCoord ), Color( :Value ) ),
	Elements( Heatmap( X, Y, Legend( 5 ) ) ),
	//Line({1,2}, {3,0}, {2,4});
	SendToReport(
		Dispatch(
			{},
			"XCoord",
			ScaleBox,
			{Min( -13 ), Max( 27 ), Inc( 1 ), Minor Ticks( 0 ), Show Major Grid( 1 ), Show Minor Grid( 1 ), Inside Ticks( 1 )}
		),
		Dispatch(
			{},
			"YCoord",
			ScaleBox,
			{Min( -6 ), Max( 70 ), Inc( 1 ), Minor Ticks( 0 ), Show Major Grid( 1 ), Show Minor Grid( 1 ), Inside Ticks( 1 )}
		),
		Dispatch(
			{},
			"400",
			ScaleBox,
			{Legend Model(
				5,
				Properties( 0, {gradient( {Color Theme( "Green Yellow Red" )} )} )
			)}
		)
	)

);


WaferMap = Open( "WaferMap.jmp" );
nbrLines = N Rows( WaferMap );
nbrCols = N Cols( WaferMap );

Report( Biv )[Framebox( 1 )] << add graphics script(
	For( n = 1, n <= nbrLines, n++,
		Pen Size( WaferMap:Ythick[n] );
		H Line( WaferMap:Xmin[n], WaferMap:Xmax[n], WaferMap:Y[n] );
	)
);

Report( Biv )[Framebox( 1 )] << add graphics script(
	For( n = 1, n <= nbrLines, n++,
		Pen Size( WaferMap:Xthick[n] );
		V Line( WaferMap:X[n], WaferMap:Ymin[n], WaferMap:Ymax[n] );
	)
);

Report( Biv )[Framebox( 1 )] << add graphics script(
	x1 = (Col Min( WaferMap:X ) + Col Max( WaferMap:X )) / 2;
	y1 = (Col Min( WaferMap:Y ) + Col Max( WaferMap:Y )) / 2;
	{r1, r2} = Report( Biv )[Framebox( 1 )] << Get Size();
	radius = (r1 + r2) / 24
	; Biv << reshow;
		//Path( [0 65 1, -11 33 0, 0 0 0, 15 0 0, 25 0 0, 26 33 0, 10 0 -3], 0 );
	//Path( [0 65 1, -11 33 0, 10 40 0, 8 0 0, 26 33 0, 10 0 -3], 0 );
	Circle( {x1, y1}, radius/* no fill for concentric circles */ );

);

Report( Biv )[Picture Box( 1 )] << Save Picture( "ShotMap" || "_.emf", EMF );
Report( Biv )[Picture Box( 1 )] << Save Picture( "ShotMap" || "_.png", PNG );
Report( Biv )[Picture Box( 1 )] << Save Picture( "ShotMap" || "_.JPEG", JPEG );

		//close(WaferMap, nosave);
Accepted Solutions

- Mark as New
- Bookmark
- Subscribe
- Mute
- Subscribe to RSS Feed
- Get Direct Link
- Report Inappropriate Content
Re: How to create stable wafer maps indicating the flat
Have a look at the annotate capability of the semiconductor toolkit. Semiconductor Toolkit
If it's not doing what you need, add a comment to the toolkit thread and we can see what's missing.
Best,
M
- Mark as New
- Bookmark
- Subscribe
- Mute
- Subscribe to RSS Feed
- Get Direct Link
- Report Inappropriate Content
Re: How to create stable wafer maps indicating the flat
- Mark as New
- Bookmark
- Subscribe
- Mute
- Subscribe to RSS Feed
- Get Direct Link
- Report Inappropriate Content
Re: How to create stable wafer maps indicating the flat
The picture did not go through.
Find it attached.
- Mark as New
- Bookmark
- Subscribe
- Mute
- Subscribe to RSS Feed
- Get Direct Link
- Report Inappropriate Content
Re: How to create stable wafer maps indicating the flat
Have a look at the annotate capability of the semiconductor toolkit. Semiconductor Toolkit
If it's not doing what you need, add a comment to the toolkit thread and we can see what's missing.
Best,
M
Recommended Articles
- © 2026 JMP Statistical Discovery LLC. All Rights Reserved.
- Terms of Use
- Privacy Statement
- Contact Us