- Don’t miss your chance to experience Discovery Summit Europe at our best available rate! Early bird registration through 31 Oct.
- Graph Builder Toolbar streamlines interactive graphing. Creates shortcuts on Report and GraphBuilder Helpers toolbars. Download and install the extension.
- Subscribe to RSS Feed
- Mark Topic as New
- Mark Topic as Read
- Float this Topic for Current User
- Bookmark
- Subscribe
- Mute
- Printer Friendly Page
Discussions
Solve problems, and share tips and tricks with other JMP users.- User Community
- :
- Discussions
- :
- How does JSL implement a click-to-get variable value in such a graph?

- Mark as New
- Bookmark
- Subscribe
- Mute
- Subscribe to RSS Feed
- Get Direct Link
- Report Inappropriate Content
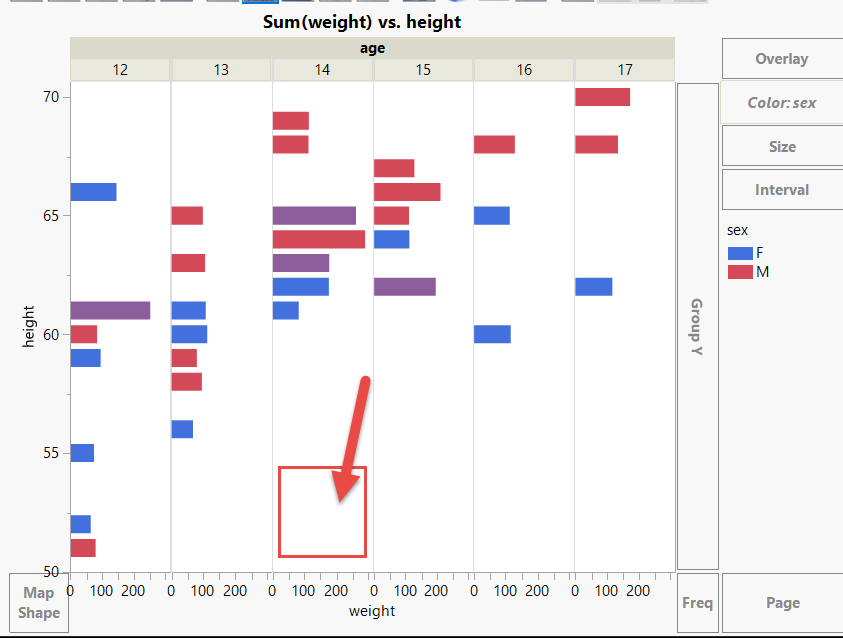
How does JSL implement a click-to-get variable value in such a graph?
Follow the script below.
dt = Open( "$SAMPLE_DATA/Big Class.jmp" );
p1 = dt << Graph Builder(
	Variables( X( :weight ), Y( :height ), Group X( :age ), Color( :sex ) ),
	Elements( Bar( X, Y, Legend( 5 ), Response Axis( "X" ), Summary Statistic( "Sum" ) ) )
);
How to write JSL How to achieve in the graph by clicking on a certain age bar, get this age value?And use this value to perform subsequent operations.
Thanks!
- Mark as New
- Bookmark
- Subscribe
- Mute
- Subscribe to RSS Feed
- Get Direct Link
- Report Inappropriate Content
回复: How does JSL implement a click-to-get variable value in such a graph?
OK
Thank Craige!
You taught me how to solve problems so that I didn't just copy code.
Thanks Experts!

- Mark as New
- Bookmark
- Subscribe
- Mute
- Subscribe to RSS Feed
- Get Direct Link
- Report Inappropriate Content
回复: How does JSL implement a click-to-get variable value in such a graph?
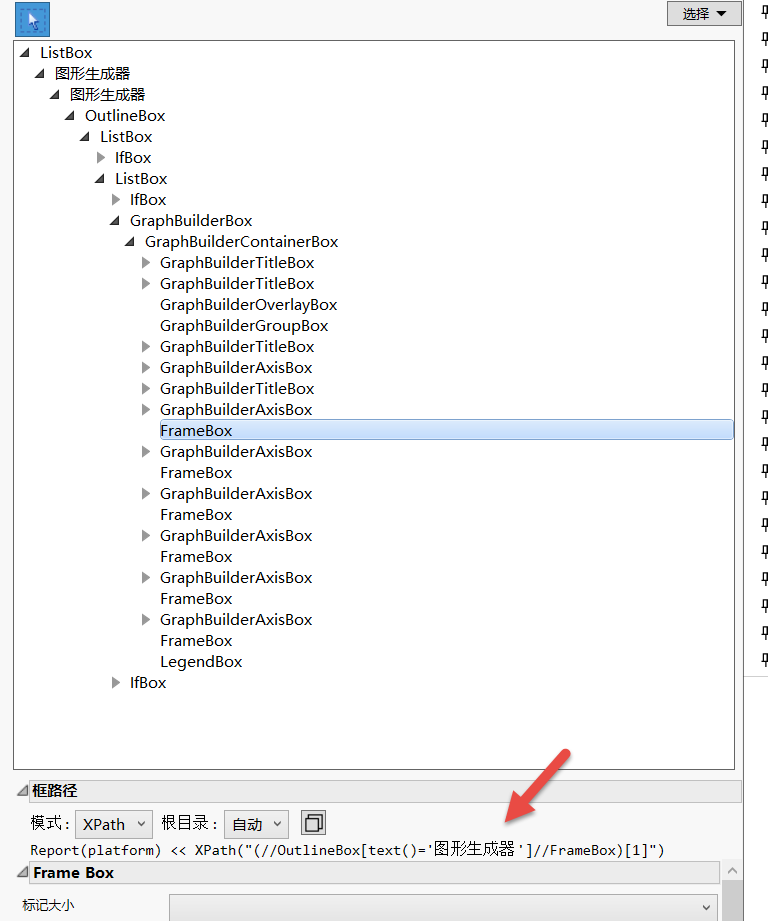
For those who are too lazy to click - or too lazy to use Expression Handling: use the Picture part of the Hover label.
The reaction is immediate (much faster than the time it takes till the hover label appears).
dt = Open( "$SAMPLE_DATA/Big Class.jmp", invisible );
gb = dt << Graph Builder(
	Show Control Panel( 0 ),
	Variables( X( :weight ), Y( :height ), Group X( :age ), Color( :sex ) ),
	Elements( Bar( X, Y, Legend( 5 ), Response Axis( "X" ), Summary Statistic( "Sum" ) ) )
);
fbs = Report( gb ) << XPath( "//FrameBox" );

For Each( {fb}, fbs,
	fb << Set Graphlet( Picture( Caption( Char( myAge = :age[local:_firstRow] ) ) ) )
);- Mark as New
- Bookmark
- Subscribe
- Mute
- Subscribe to RSS Feed
- Get Direct Link
- Report Inappropriate Content
回复: How does JSL implement a click-to-get variable value in such a graph?
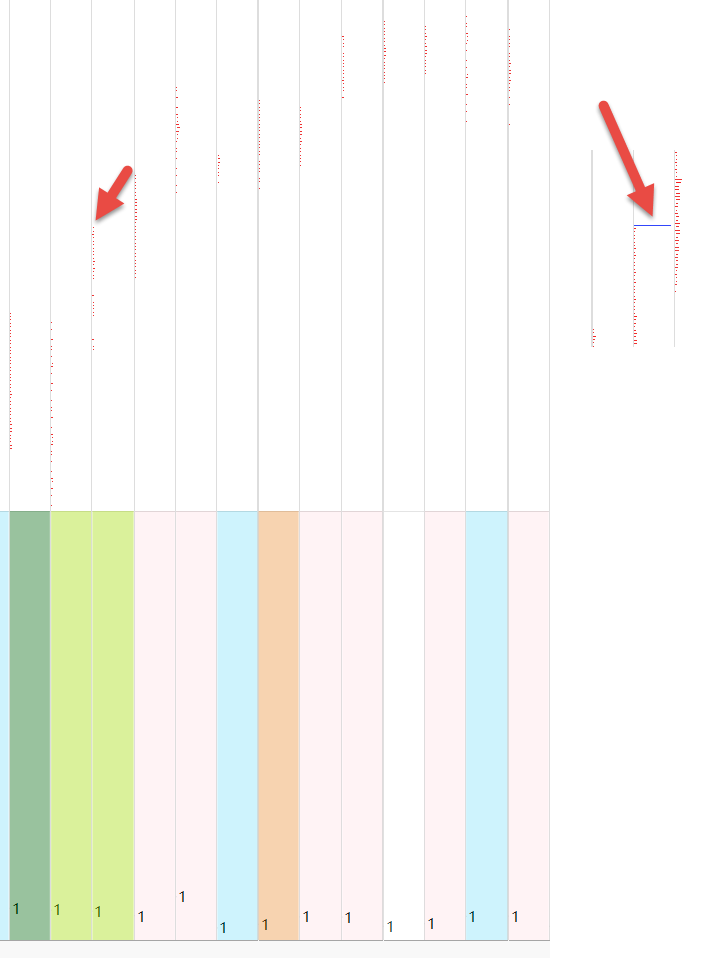
I can only click.
Because some columns have small graphics (other columns have large data), it is difficult to point to hover.
- Mark as New
- Bookmark
- Subscribe
- Mute
- Subscribe to RSS Feed
- Get Direct Link
- Report Inappropriate Content
回复: How does JSL implement a click-to-get variable value in such a graph?
and if you are too lazy to hit the bars - just
- add a HeatMap plot
- with disabled x and y variables
- and transparency set to 0:
dt = Open( "$SAMPLE_DATA/Big Class.jmp", invisible );
gb = dt << Graph Builder(

	Variables( X( :weight ), Y( :height ), Group X( :age ), Color( :sex ) ),
	Elements(
		Bar(
			X,
			Y,
			Response Axis( "X" ),
			Summary Statistic( "Sum" )
		),
		Heatmap( Legend( 6 ) )
	),
	SendToReport(
		Dispatch( {"Heatmap"}, "", OutlineBox, {Close( 0 )} ),
		Dispatch( {}, "400", ScaleBox,
			{Legend Model(
				6,
				Base( 0, 0, 0, Item ID( "F", 1 ) ),
				Base( 1, 0, 0, Item ID( "M", 1 ) ),
				Properties( 0, {Transparency( 0 )}, Item ID( "F", 1 ) ),
				Properties( 1, {Transparency( 0 )}, Item ID( "M", 1 ) )
			)}
		))
);
fbs = Report( gb ) << XPath( "//FrameBox" );

For Each( {fb}, fbs,
	fb << Set Graphlet( Picture( Caption( Char( myAge = :age[local:_firstRow] ) ) ) )
);
- Mark as New
- Bookmark
- Subscribe
- Mute
- Subscribe to RSS Feed
- Get Direct Link
- Report Inappropriate Content
回复: How does JSL implement a click-to-get variable value in such a graph?
Still want to trigger scripts by clicking on graphics, not by Hover Labels
But this graphic changes form, and I don't know how to change to write JSL.
I had to go back to the experts.
Thanks!
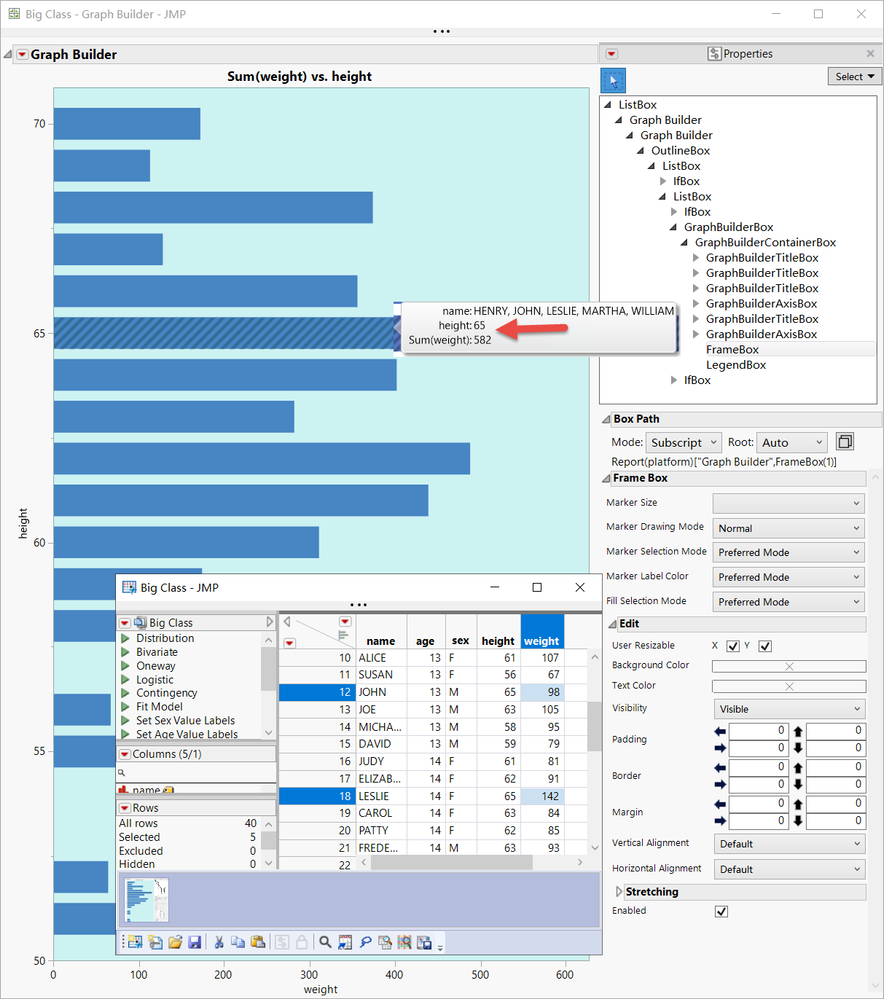
I can only write a script like this, but cannot execute it:
dt = Open( "$SAMPLE_DATA/Big Class.jmp" );
p1 = dt << Graph Builder(
	Size( 632, 1152 ),
	Show Control Panel( 0 ),
	Show Legend( 0 ),
	Variables( X( :weight ), Y( :height ) ),
	Elements(
		Bar( X, Y, Legend( 5 ), Bar Style( "Stacked" ), Response Axis( "X" ), Summary Statistic( "Sum" ) )
	)
);
gp = Report(p1)["Graph Builder",FrameBox(1)]
Eval(
	Eval Expr(
		gp << Addgraphicsscript(
			Mousetrap(
				{},
				a0 = Expr( iFrame );
				dt << Select Where( :height == a0 );
				dt << Select Columns( "height" );
				d3 = dt << Subset( Output Table( "test" ), Selected Rows( 1 ), columns( height ) );
			)
		)
	)
);

- Mark as New
- Bookmark
- Subscribe
- Mute
- Subscribe to RSS Feed
- Get Direct Link
- Report Inappropriate Content
回复: How does JSL implement a click-to-get variable value in such a graph?
Check the log, there is a missing ; and undefined variable iFrame which you don't need because there is only one frame. The original example embedded the frame number into each script. You don't need the eval(evalexpr(...expr(...)...)) because you no longer have the iFrame to embed in the expr(...)
MouseTrap is the strangest function in all of JMP. When it is called, it does nothing at all. And you don't have to place it where it will be called, but you DO have to place it in the body of the script, not in a user function outside of the script. MouseTrap is a way to supply a snippet of JSL that will run when the mouse moves. When the mouse moves over the framebox, JMP looks for handler functions in the attached graphic scripts and calls them until one handles the mouse.
- Mark as New
- Bookmark
- Subscribe
- Mute
- Subscribe to RSS Feed
- Get Direct Link
- Report Inappropriate Content
回复: How does JSL implement a click-to-get variable value in such a graph?
Thank Craige!
Yes, one of my code changes was deleted by mistake;
Since my actual generated graph bar graph is very small, using Hover Labels is prone to errors and raises unwanted data.So I still need to trigger the script by clicking on the bar chart.
I want to modify it by imitating the script given by the expert earlier in this post.But I studied for a long time, still do not know how to modify.You can only post again to ask the experts for help.
Thanks Experts!
- Mark as New
- Bookmark
- Subscribe
- Mute
- Subscribe to RSS Feed
- Get Direct Link
- Report Inappropriate Content
回复: How does JSL implement a click-to-get variable value in such a graph?
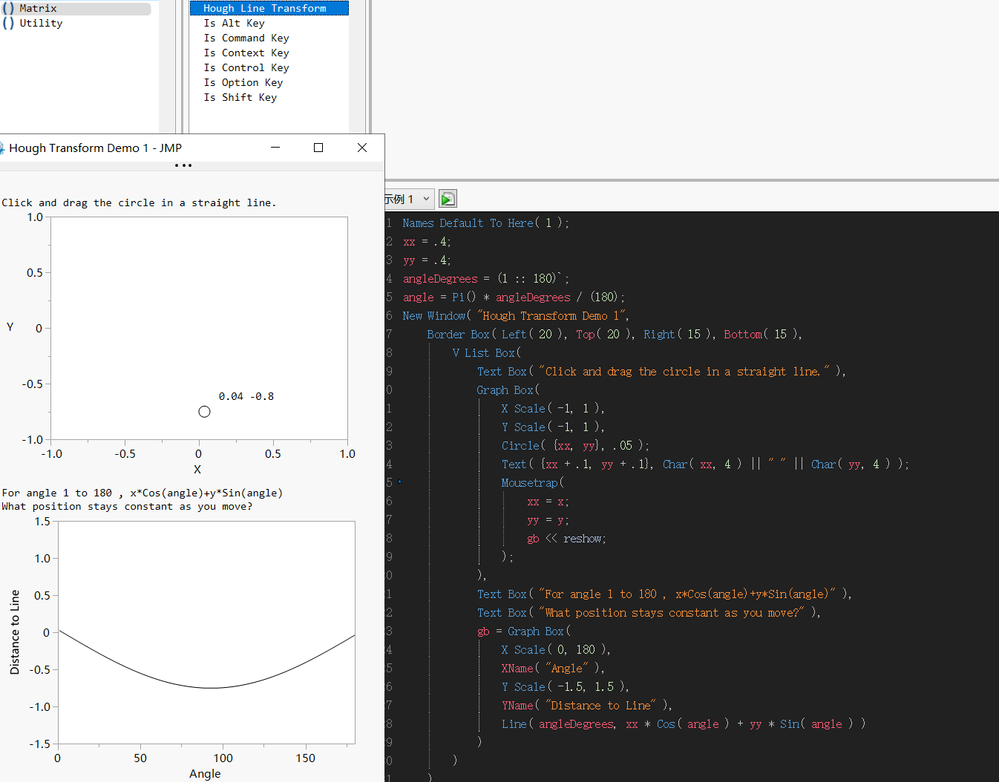
Interesting example.
- Mark as New
- Bookmark
- Subscribe
- Mute
- Subscribe to RSS Feed
- Get Direct Link
- Report Inappropriate Content
回复: How does JSL implement a click-to-get variable value in such a graph?
frame = (gp << report)[FrameBox( 1 )];
frame << Set Graphlet(
	Picture(
		Try( Close( d3, nosave ) );
		Current Data Table( dt );
		d3 = dt << Subset(
			Output Table( "tt" ),
			Selected Rows( 0 ),
			Rows( dt << Get Selected Rows() ),
			Selected columns only( 0 )
		);
	),
	Reapply( 1 )
);
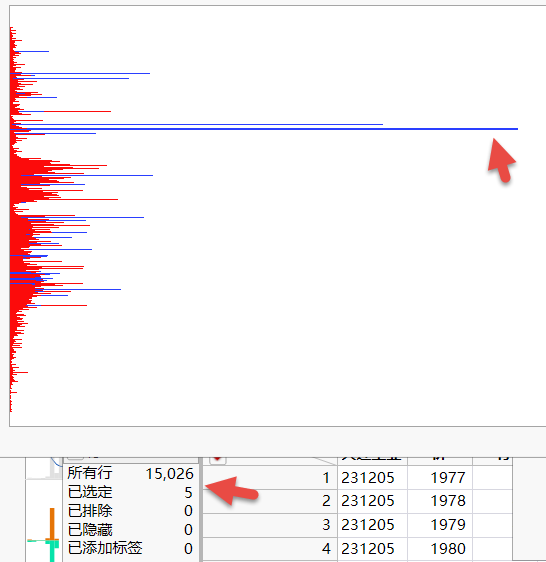
This allows mouse clicks and Hover Labels to be used simultaneously.
Click can implement the selected line, Hover Labels can extract a subset of the selected line.
Thanks!
- Mark as New
- Bookmark
- Subscribe
- Mute
- Subscribe to RSS Feed
- Get Direct Link
- Report Inappropriate Content
回复: How does JSL implement a click-to-get variable value in such a graph?
- « Previous
-
- 1
- 2
- Next »
Recommended Articles
- © 2026 JMP Statistical Discovery LLC. All Rights Reserved.
- Terms of Use
- Privacy Statement
- Contact Us