- Instantly extract effect sizes, F-ratios, and FDR-adjusted p-values from your models with the Calculate Effects Sizes extension, available now in the JMP Marketplace!
- New to JMP? Join us Sept. 23-24 for the Early User Edition of Discovery Summit, tailor-made for new users. Register now for free!
- Use World Cup data to build models, explore spatial relationships, and create informative visualizations in JMP. Register. July 17, 2 pm US Eastern Time.
- Subscribe to RSS Feed
- Mark Topic as New
- Mark Topic as Read
- Float this Topic for Current User
- Bookmark
- Subscribe
- Mute
- Printer Friendly Page
Discussions
Solve problems, and share tips and tricks with other JMP users.- JMP User Community
- :
- Discussions
- :
- How do I do a combination bar and line plot using Overlay Plot?

- Mark as New
- Bookmark
- Subscribe
- Mute
- Subscribe to RSS Feed
- Get Direct Link
- Report Inappropriate Content
How do I do a combination bar and line plot using Overlay Plot?
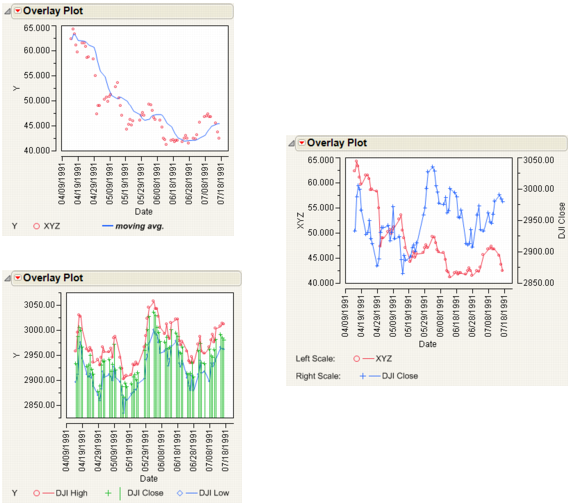
Using JMP 12. I want to change the options for the two y axes independently of each other such that one of them has a bar plot and the other has a line plot. I don't want to do this with Graph Builder because the output is too cumbersome for my combination of graphs. There must be a way to do this because I can see it in the examples on this page:
How do I independently select which series get points connected and which has the needle?
Thanks!
Accepted Solutions

- Mark as New
- Bookmark
- Subscribe
- Mute
- Subscribe to RSS Feed
- Get Direct Link
- Report Inappropriate Content
Re: How do I do a combination bar and line plot using Overlay Plot?
Scott, in this example you can select the overlay marker, connect color, line style, and other graph options for each variable (Y) after you create the overlay plot. You can do this directly from the legend. Left click on the variable in the legend (in the bottom picture, you would select DJI Close) and it becomes highlighted. Then right click to bring up options for the highlighted variable (in the bottom picture, when DJI Close is selected, you would select needle).
- Mark as New
- Bookmark
- Subscribe
- Mute
- Subscribe to RSS Feed
- Get Direct Link
- Report Inappropriate Content
Re: How do I do a combination bar and line plot using Overlay Plot?
That does it. Thanks!
Recommended Articles
- © 2026 JMP Statistical Discovery LLC. All Rights Reserved.
- Terms of Use
- Privacy Statement
- Contact Us