cancel
Showing results for 
Show  only  | Search instead for 
Did you mean: 
  • Don’t miss your chance to experience Discovery Summit Europe at our best available rate! Early bird registration through 31 Oct.
  • Graph Builder Toolbar streamlines interactive graphing. Creates shortcuts on Report and GraphBuilder Helpers toolbars. Download and install the extension.
  • JMP will suspend normal business operations for our Rest and Recharge Day on Friday, October 2, 2026.
    Regular business hours will resume on Monday, October 5, 2026.

Discussions

Solve problems, and share tips and tricks with other JMP users.
Choose Language Hide Translation Bar
jorgeramosdealm
Level III

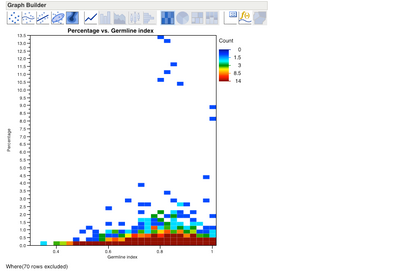
Heat Map box customization

Does anyone know how to change the size of the boxes from a heat map?

2277_heatmap.png

File is in attachment.

1 REPLY 1
XanGregg
Staff

Re: Heat Map box customization

I think the sizes are based on the default histogram binning, which is largely based on the number of rows. I'm afraid I don't see a way to override that. Summarizing the data so that there are fewer rows may help. For example,

  1. use Distribution to make histograms of those two columns
  2. adjust the bins
  3. Save Level Midpoints for each histogram
  4. Table > Summary by the two midpoint columns, which produces a new table with those two columns plus an N Rows column.
  5. Graph the two variables as X and Y and put N Rows in the Freq column.

If you find binning that works, you'll probably want to edit the last germline midpoint so it is less than 1 so those values don't spill into the next cell.

Recommended Articles