JMP Blog
A blog for anyone curious about data visualization, design of experiments, statistics, predictive modeling, and more- JMP User Community
- :
- Blogs
- :
- JMP Blog
- :
- Multiple-Group Analysis in Structural Equation Modeling
- Subscribe to RSS Feed
- Mark as New
- Mark as Read
- Bookmark
- Subscribe
- Printer Friendly Page
- Report Inappropriate Content
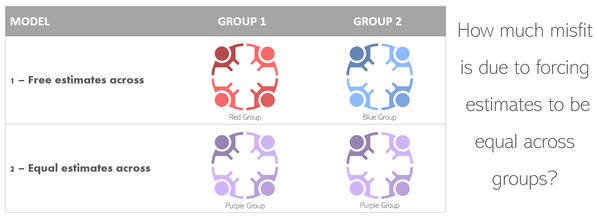
Multiple-group analysis (MGA) is a statistical technique that allows researchers to investigate differences across subpopulations, or demographic segments, by enabling specification of structural equations models (SEMs) with group-specific estimates or with equal estimates across groups.
Differences in means, regressions, loadings, variances, and covariances of variables can be investigated using MGA, as all these parameters can be modeled in SEM. Thus, even though other modeling techniques (e.g., analysis of variance or regression with interaction effects) make it possible to investigate the role of a grouping variable, those techniques are less flexible than MGA in SEM.
Figure 1. General overview of multiple-group analysis and the strategy for making inferences.
Common Uses of Multiple-Group Analysis
Anytime there is interest in exploring group differences, MGA can be a helpful tool. When data are gathered on individuals, groups are most often defined based on factors with few levels (e.g., gender, ethnicity, occupation, family status, health status, etc.) but can also be defined based on a variety of other factors depending on the field, data, and analytic context. Some examples of questions that can be answered with MGA in a few different fields are,
- Consumer research
- Is product satisfaction (or quality) different across demographic segments?
- People analytics
- Is employee performance (or motivation) equal across company branches or divisions?
- Health care
- Do patient reported outcomes differ based on drug manufacturer?
- Marketing
- Is new marketing campaign effective at increasing brand reputation in different geographical areas?
- Psychology
- Are there cross-cultural differences in emotional experience?
- Education
- Is growth in academic achievement equal across females and males?
Measuring Unobserved Variables in Multiple Groups
All questions listed above involve variables that are unobserved (e.g., satisfaction, performance, etc.), also known as latent variables. Because these variables cannot be observed directly, they are difficult to measure.
Figure 2. Comparing measurement of unobserved (latent) versus observed variables.
One such difficulty is that different groups can have different conceptualizations of these variables. Ask yourself:
What is satisfaction?
What is good performance?
Is it likely that your responses to these questions would be different than those with different life experiences?
Many times, the answer is yes.
Thankfully, we can test empirically whether different groups conceptualize latent variables in a similar way. This test is carried out with MGA in the SEM framework and is known as factorial invariance. Factorial invariance tests are critical to ensure comparisons across groups are valid; therefore, these tests must be done prior to comparing regressions or means across groups (aka structural parameters) if latent variables are present.
Figure 3. The challenge of modeling unobserved variables is that they might not be measuring the same thing across subpopulations.
Testing for Differences in Parameters
To test for differences in parameters across groups, researchers usually fit SEMs with and without equality constraints across groups. Then, the two resulting models are compared using a likelihood ratio test (equivalently, a chi-square difference test) to assess whether imposing constraints produce statistically significant worsening of model fit. If the fit of the model does not worsen significantly, then the model with equality constraints is retained, and one concludes that the populations under consideration do not differ significantly on the parameter(s) tested. In contrast, if the fit of the model worsens significantly, the model without constraints (i.e., where each group is allowed to have its own estimate(s)) is retained, and one concludes that the populations under consideration differ significantly on the parameter(s) tested.
The figure below illustrates the strategy behind MGA in a two-group example where a simple linear regression is fit. This figure shows equality constraints placed on one parameter. Model 1 has zero degrees of freedom (i.e., it’s fully saturated), whereas Model 2 has one degree of freedom resulting from the equality constraint. These models are compared based on the difference of their chi-squares, which is also chi-square distributed with degrees of freedom equal to one (the difference between degrees of freedom across models). A less specific test can be conducted by placing equality constraints on multiple parameters at a time.
Figure 4. Strategy behind MGA in a two-group example with a simple linear regression.
SEMs were developed as confirmatory models. That is, one devises hypotheses, translates them into a testable statistical model, and inferences are used to determine if the data support the hypotheses. This approach is also applied in MGA and is critical to avoid large type I error rates, which lead to finding statistical effects that are not truly present in the population(s) of study. For this reason, conducting all-possible comparisons across groups is not recommended.
Intuition Behind MGA Estimation
Disclaimer: The paragraphs below are for methodologists that wish to deepen their understanding of MGA. This section assumes readers understand the full-information maximum likelihood estimator. Moreover, the steps outlined here are only for explaining the logic behind MGA. In reality, conducting MGA with these steps would be inefficient because statistical software should leverage algorithms that simplify this process.
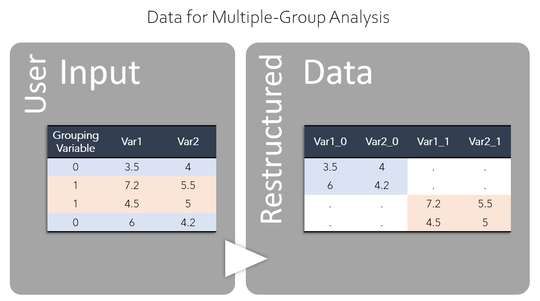
The estimation of MGA is not different from that of a simple SEM with missing data. In a standard implementation of MGA-SEM, users submit the data they want to analyze along with a grouping variable, which indicates the group that each observation belongs to. A simple data manipulation step —using the grouping variable—is required to set up the analysis for multiple groups. The figure below illustrates the data that are supplied for analysis and the restructuring of data for MGA.
Figure 5. Data inputted by users and data after restructuring for doing multiple-group analysis.
The resulting data can now be used with full information maximum likelihood as the estimator to ensure all rows in the data are submitted for analysis despite there being missing data. A few convenient results from the restructured data are:
- The log likelihood of any given row is only influenced by the non-missing cells, such that adding the log likelihood of all the 'Group 0' rows yields the log likelihood for that group. Similarly, adding the log likelihood of all 'Group 1' rows yields the log likelihood for group 1. Each group’s log likelihood is used to estimate a chi-square statistic for the overall model, which quantifies the misfit for each group.
- The pattern of missing values prohibits estimation of any parameter across the groups’ variables (e.g., the covariance of Var1_0 and Var1_1 is not estimable), which is inconsequential because MGA is concerned with comparison of effects across groups rather than cross-group estimates.
- ‘Vanilla SEM’ allows one to set equality constraints on parameters. Thus, using the restructured data in SEM, one can specify two identical models with each group’s subset of variables, and equality constraints can be placed on equivalent parameters across the groups. To reiterate, all of this can be done in standard SEM without asking the software to conduct MGA explicitly.
Thankfully, these steps don’t need to be performed by users who want to do MGA-SEM! Indeed, the SEM platform in JMP Pro 17 now has a simple and intuitive user-interface for conducting MGA—take a peak in the image below! You can leave the tedious tasks to JMP Pro and focus on your analyses and research questions instead.
Figure 6. User interface in JMP Pro for multiple-group analysis in the structural equation models platform.
- © 2026 JMP Statistical Discovery LLC. All Rights Reserved.
- Terms of Use
- Privacy Statement
- Contact Us


You must be a registered user to add a comment. If you've already registered, sign in. Otherwise, register and sign in.