- Subscribe to RSS Feed
- Mark Topic as New
- Mark Topic as Read
- Float this Topic for Current User
- Bookmark
- Subscribe
- Mute
- Printer Friendly Page
Discussions
Solve problems, and share tips and tricks with other JMP users.- JMP User Community
- :
- Discussions
- :
- HOW TO FIND MINIMA/MAXIMA IN JMP?

- Mark as New
- Bookmark
- Subscribe
- Mute
- Subscribe to RSS Feed
- Get Direct Link
- Report Inappropriate Content
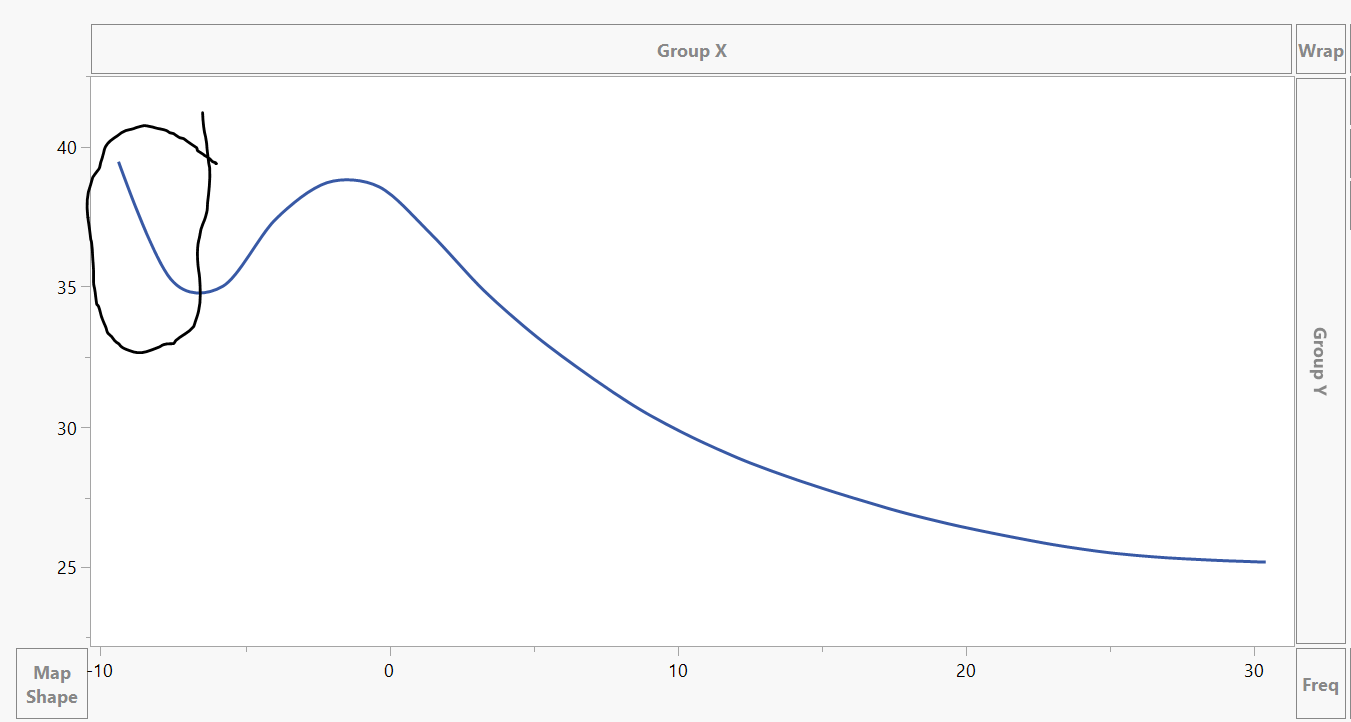
HOW TO FIND MINIMA/MAXIMA IN JMP?
Is there a way to find this minima(as shown in figure) and exclude data to its left.


- Mark as New
- Bookmark
- Subscribe
- Mute
- Subscribe to RSS Feed
- Get Direct Link
- Report Inappropriate Content
Re: HOW TO FIND MINIMA/MAXIMA IN JMP?
I'm not the right person to answer this, but it probably need a bit more information to understand what sort of answer fits:
Is the data really that smooth? Or is the data noisy?
Do you just need the first row that is bigger than the previous row?
Is there an equation generating the data?
- Mark as New
- Bookmark
- Subscribe
- Mute
- Subscribe to RSS Feed
- Get Direct Link
- Report Inappropriate Content
Re: HOW TO FIND MINIMA/MAXIMA IN JMP?
Hi Craige,
Thank you for the response. I have attached the data table( Minima_Jmp) with X and Y columns for this graph.
Following are my responses:
1] Is the data really that smooth? Or is the data noisy?
Ans : Data is noisy - as shown in below 2 graphs
2] Do you just need the first row that is bigger than the previous row?
Ans: This question isnt very clear to me - I would find the first minima point and exclude all the data to its left
3] Is there an equation generating the data?
And: No there isnt an equation for this data - Maybe we can fit an equation to describe the curve but that only be an approximation


- Mark as New
- Bookmark
- Subscribe
- Mute
- Subscribe to RSS Feed
- Get Direct Link
- Report Inappropriate Content
Re: HOW TO FIND MINIMA/MAXIMA IN JMP?
Your original question appears to be about a spline, fit to the noisy data, and finding the first minimum of that spline. For the example data, this seems to work:
dt = Open( "Z:/Minima_JMP.jmp" );
dt << sort( by( x ), replacetable( 1 ) );
obj = dt << Bivariate(
	Y( :Y ),
	X( :X ),
	Fit Spline( 26.8534445, {Line Color( {66, 112, 221} )} ),
	Automatic Recalc( 1 ),
	SendToReport( Dispatch( {}, "Bivar Plot", FrameBox, {Frame Size( 1653, 240 )} ) )
);
obj << (Curve["Smoothing Spline Fit, lambda=26.8534445"] << Save Predicteds);

For( irow = 2, irow < N Rows( dt ), irow += 1,
	If( dt:Spline Predictor for Y[irow] > dt:Spline Predictor for Y[irow - 1],
		Write( Eval Insert( "the inflection upward trend begins around row ^irow^" ) );
		// choose one of these...
		dt << selectrows( 1 :: irow );
//		dt<<deleterows(1::irow);
		Break();
	)
);
If( irow >= N Rows( dt ),
	Write( "not found?" )
);
In the log: the inflection upward trend begins around row 231
That is after sorting the table by ascending X.
You'll get different answers by adjusting the spline's tension (lambda=...). Make sure to delete the predicted column before rerunning the script, or close the table without saving.
This idea will break if the actual shape of the data doesn't match your example; if it is already trending up at the beginning, etc.
This may not be the correct way to do what you need; I think you'll have to explain what sort of process the data comes from and why you want to find this point in the data in order to get other people to add some ideas.
- Mark as New
- Bookmark
- Subscribe
- Mute
- Subscribe to RSS Feed
- Get Direct Link
- Report Inappropriate Content
Re: HOW TO FIND MINIMA/MAXIMA IN JMP?
Hi Craige,
This looks wonderful. I will try it on other data tables and check.
Is there a way we can find a suitable lambda value if I have to automate this analysis for multiple data tables of similar data?
Thank you.
- Mark as New
- Bookmark
- Subscribe
- Mute
- Subscribe to RSS Feed
- Get Direct Link
- Report Inappropriate Content
Re: HOW TO FIND MINIMA/MAXIMA IN JMP?
I don't know. I think it is part science, part art, especially with splines. I think you'll want to add some sanity checks to the code if you try to automate it without visually inspecting the results. If it is possible for your process to produce an extra oscillation at the beginning, this will clearly fail. Or more data, or less data, or differently dense/sparse over the range, etc. might change the results.
There are people that might suggest other models that are specific to processes or industries. They would need more information about the data.
Recommended Articles
- © 2026 JMP Statistical Discovery LLC. All Rights Reserved.
- Terms of Use
- Privacy Statement
- Contact Us