- Due to inclement weather, JMP support response times may be slower than usual during the week of January 26.
To submit a request for support, please send email to support@jmp.com.
We appreciate your patience at this time. - Register to see how to import and prepare Excel data on Jan. 30 from 2 to 3 p.m. ET.
- Subscribe to RSS Feed
- Mark Topic as New
- Mark Topic as Read
- Float this Topic for Current User
- Bookmark
- Subscribe
- Mute
- Printer Friendly Page
Discussions
Solve problems, and share tips and tricks with other JMP users.- JMP User Community
- :
- Discussions
- :
- Re: Formatting column within control chart builder jsl
- Mark as New
- Bookmark
- Subscribe
- Mute
- Subscribe to RSS Feed
- Get Direct Link
- Report Inappropriate Content
Formatting column within control chart builder jsl
Hello,
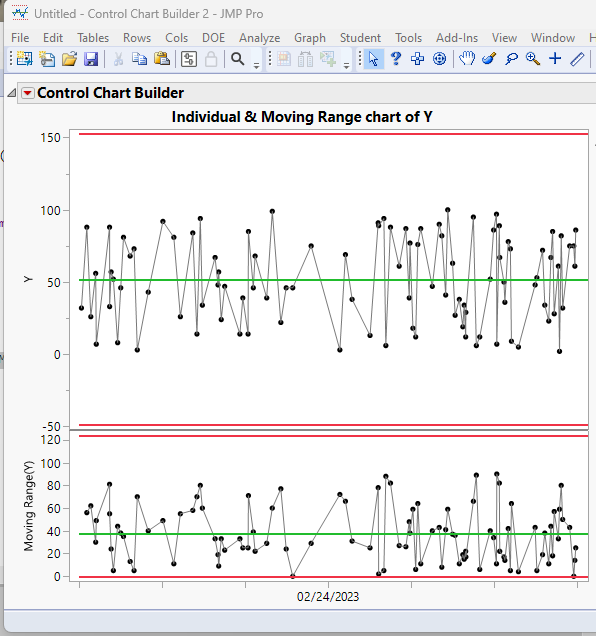
I am having an issue creating a control chart when trying to script it with JSL on JMP17. I have a column that contains a long date and time in the format "02/24/2023 8:22:00 PM". I would like to use the formula Abbrev Date () to change the format of the label on the X-axis to only the date "02/24/2023" to reduce the clutter in the control chart. If this isn't the best way to do it, please point me in the right direction.
Thanks!
TruePosition = Control Chart Builder(
	Variables( Y( :Y ), Label( Abbrev Date ( :TestTime ) ) ),
	SendToReport(
		Dispatch( {}, "Y", ScaleBox, {Min( 0 ), Max( 200 ), Inc( 20 ), Minor Ticks( 1 )} )
	)
);- Mark as New
- Bookmark
- Subscribe
- Mute
- Subscribe to RSS Feed
- Get Direct Link
- Report Inappropriate Content
Re: Formatting column within control chart builder jsl
Here is how I would handle this
theLabel = format(:testtime[1],"m/d/y");
eval(substitute(expr(Control Chart Builder(
	Variables( Subgroup( :testtime ), Y( :Y ) ),
	Show Control Panel( 0 ),
	SendToReport(
		Dispatch( {}, "testtime", ScaleBox, {Label Row( Show Major Labels( 0 ) )} ),
		Dispatch(
			{},
			"Subgroup display 1 title",
			TextEditBox,
			{Set Text( __label__ )}
		)
	)
)),expr(__label__), theLabel));
- Mark as New
- Bookmark
- Subscribe
- Mute
- Subscribe to RSS Feed
- Get Direct Link
- Report Inappropriate Content
Re: Formatting column within control chart builder jsl
Thanks Jim. Why do you prefer to edit the subgroup to change the x-axis vs having as a label? When I use the subgroup I get a nasty looking graph because it takes every date as a different subgroup. Seems like the Label function in control chart builder is designed to change the x-axis label?
I also found a workaround if I create a new column with a formula I can change the format of the date there and use it in graph builder.
- Mark as New
- Bookmark
- Subscribe
- Mute
- Subscribe to RSS Feed
- Get Direct Link
- Report Inappropriate Content
Re: Formatting column within control chart builder jsl
I apologize if what I responded with did not answer your question. Given the code you provided, I assumed that you were creating an individual chart and that the issue was just an issue of the X axis being too cluttered and because of that, you only wanted to display the day as the label, because all of your data for the chart were for just one day.
I added the subgroup options, because it gave an easy way to change the displayed label.
Apparently I did not interpret your statements correctly
Here is another approach that does not use a subgroup
theLabel = format(:testtime[1],"m/d/y");

ccb = Control Chart Builder(
	Variables( Y( :Y ) ),
	Show Control Panel( 0 )
);
report(ccb)["Control Chart Builder",TextEditBox(4)] << set text( theLabel );
.
- Mark as New
- Bookmark
- Subscribe
- Mute
- Subscribe to RSS Feed
- Get Direct Link
- Report Inappropriate Content
Re: Formatting column within control chart builder jsl
Thanks again. I was just curious if I was doing something wrong. I know it's hard to guess at what I am trying to do when I can't share the data table. Your script above works for adding labels.
Another question is how I can use a formula within the control chart builder command so that I could make changes to number formats or values on the fly instead of building a new column?
Recommended Articles
- © 2026 JMP Statistical Discovery LLC. All Rights Reserved.
- Terms of Use
- Privacy Statement
- Contact Us


