- Don’t miss your chance to experience Discovery Summit Europe at our best available rate! Early bird registration through 31 Oct.
- Graph Builder Toolbar streamlines interactive graphing. Creates shortcuts on Report and GraphBuilder Helpers toolbars. Download and install the extension.
- JMP will suspend normal business operations for our Rest and Recharge Day on Friday, October 2, 2026.
Regular business hours will resume on Monday, October 5, 2026.
- Subscribe to RSS Feed
- Mark Topic as New
- Mark Topic as Read
- Float this Topic for Current User
- Bookmark
- Subscribe
- Mute
- Printer Friendly Page
Discussions
Solve problems, and share tips and tricks with other JMP users.- User Community
- :
- Discussions
- :
- Fit y by x

- Mark as New
- Bookmark
- Subscribe
- Mute
- Subscribe to RSS Feed
- Get Direct Link
- Report Inappropriate Content
Fit y by x
Dear JMP community,
I collected datasets for the absorption behaviour for 2 different dyes. So I made absorption measurement for 3 different dilution series of the 2 dyes and consequentely want to analyze the data sets with JMP. My final goal is to get an averaged extinction coefficient of the 2 dyes and analyze each resulting graph (linear correlation) statistically among themselves. So far I just managed to analyze each graph by themself with Fit y by x. Can somebody help me with this problem?
Best regards
Accepted Solutions


- Mark as New
- Bookmark
- Subscribe
- Mute
- Subscribe to RSS Feed
- Get Direct Link
- Report Inappropriate Content
Re: Fit y by x
You can use Bivariate as before but include the three replicates in the regression analysis. Do not average the dilution series first. Put Dye in the By role to separate the data analysis but confine the results to one window.
Here is mock up of your study:
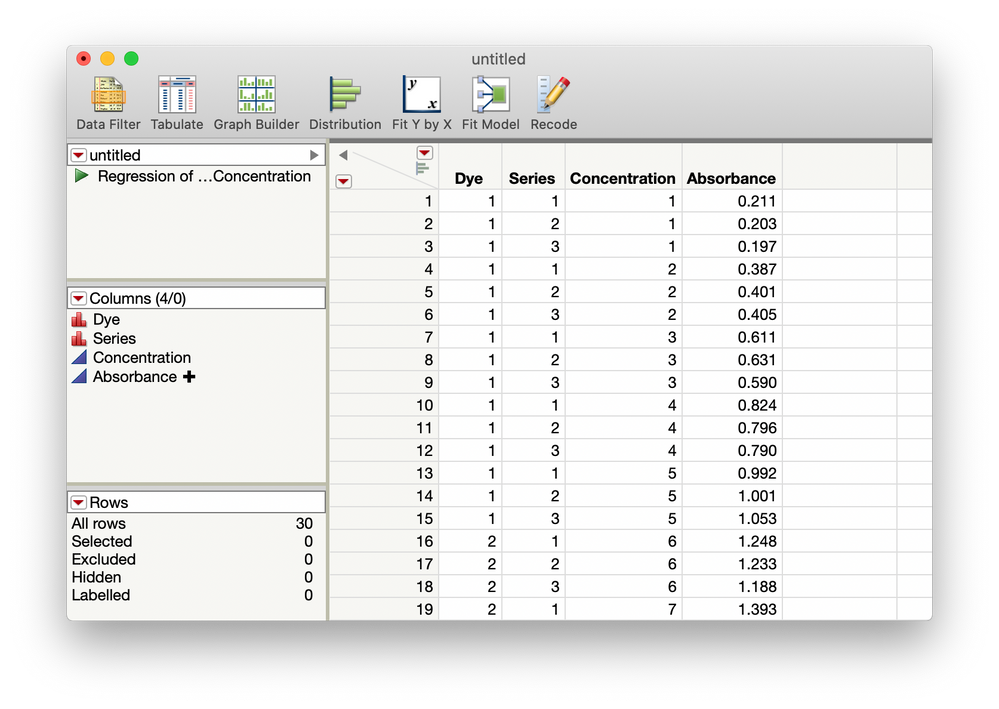
Here is the resulting analysis:
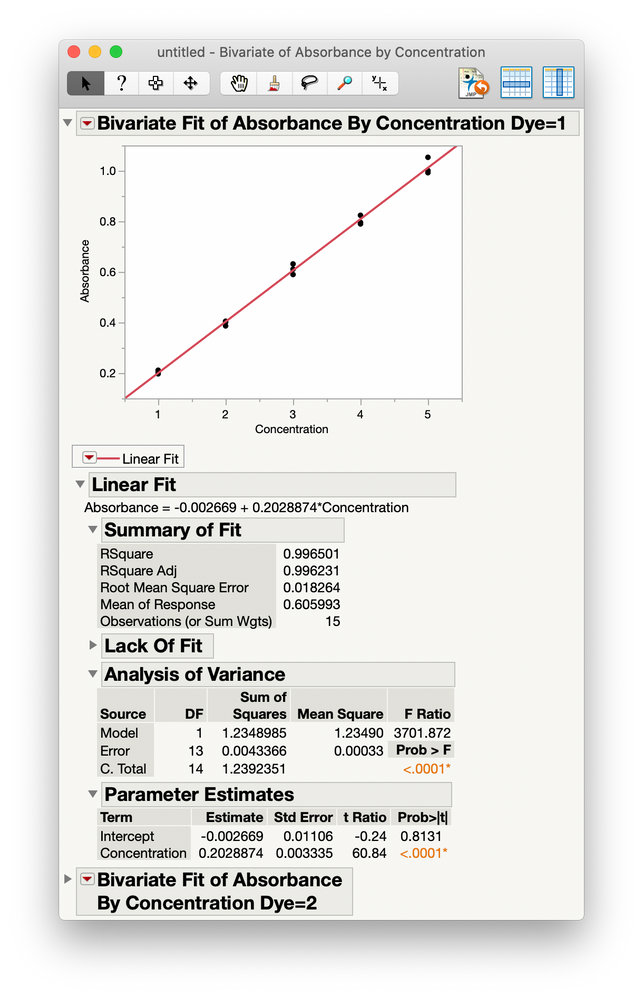
I saved the script for this analysis to the data table. I attached the data table with the mock up of your study.
- Mark as New
- Bookmark
- Subscribe
- Mute
- Subscribe to RSS Feed
- Get Direct Link
- Report Inappropriate Content
Re: Fit y by x
You can use Bivariate as before but include the three replicates in the regression analysis. Do not average the dilution series first. Put Dye in the By role to separate the data analysis but confine the results to one window.
Here is mock up of your study:
Here is the resulting analysis:
I saved the script for this analysis to the data table. I attached the data table with the mock up of your study.
- Mark as New
- Bookmark
- Subscribe
- Mute
- Subscribe to RSS Feed
- Get Direct Link
- Report Inappropriate Content
Re: Fit y by x
@Mark_Bailey Thank you very much for your quick response. Your solution helped me a lot. I made the misstake to sort the data for each series in seperate columns so I couldn't analyze all at once.
Recommended Articles
- © 2026 JMP Statistical Discovery LLC. All Rights Reserved.
- Terms of Use
- Privacy Statement
- Contact Us