- Subscribe to RSS Feed
- Mark Topic as New
- Mark Topic as Read
- Float this Topic for Current User
- Bookmark
- Subscribe
- Mute
- Printer Friendly Page
Discussions
Solve problems, and share tips and tricks with other JMP users.- JMP User Community
- :
- Discussions
- :
- Re: Extracting many linear regression fits (including confidence intervals) with...
- Mark as New
- Bookmark
- Subscribe
- Mute
- Subscribe to RSS Feed
- Get Direct Link
- Report Inappropriate Content
Extracting many linear regression fits (including confidence intervals) without using scripting
Hi,
I am looking for a way to easily obtain the slope of a regression fit and its 90 or 95% confidence intervals, without using JSL/scripting.
My current experimental design looks a bit like this:
outcome measure (4 different measures, on the same y-axis/scale, let's call them concentration 1-4)
x-axis measure: time in days
grouped by:
production type (2 factors)
temperature (2 factors)
production site (2 factors)
In total I thus need 32 different regression fits (4 outcome measures per unique group factor combinations, with 8 unique group factor combinations).
Using graph builder I can easily make graphs with have 8 subgraphs, 1 per unique combination, and in each subgraph the 4 different outcome measures.
Using graph builder I can also easily make the linear regression appear and get the formula for the regression, which has the slope of the curve.
Is there a way to also get the confidence interval from this slope in graph builder?
Alternatively I tried to use the "Analysis->Fit Y by X"
This analysis does fit the data and gives me both the slope and confidence interval limits.
But to get these I need to manually select the "fit line" option and then also add the upper and lower limits of the confidence interval to the table, for each and every unique combination and outcome measurement (so a total of 32 times).
This feels like I am doing something quite inefficient.
As I need to to do this a lot more in the future, I'd like to know if this is the best method to do this, or that I am overlooking something.
Ideally I would get a table with the slope of the line of fit together with the confidence limits for each of my combinations so that I can plot the slopes together with the confidence interval.
Any help is greatly appreciated
Accepted Solutions
- Mark as New
- Bookmark
- Subscribe
- Mute
- Subscribe to RSS Feed
- Get Direct Link
- Report Inappropriate Content
Re: Extracting many linear regression fits (including confidence intervals) without using scripting
I think there are two shortcuts that will help you significantly with this.
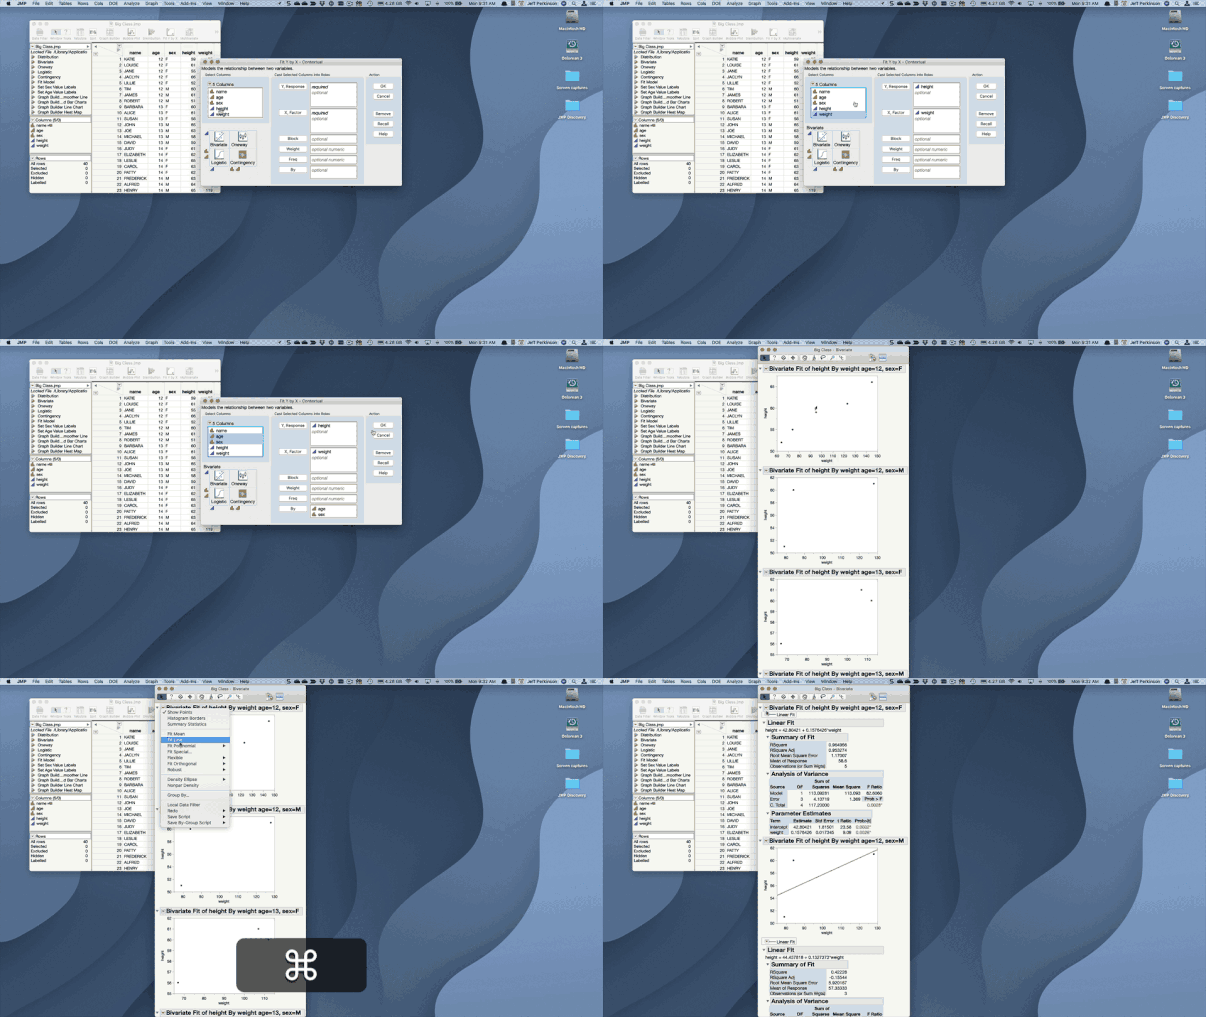
The Ctrl/Cmd key will broadcast options from the red triangle menus across a report. So, you can use Fit Y by X with your four responses in the Y, time in X and By your three other columns (production type, temperature, production site).
Then hold down the Ctrl (Windows) or Cmd (Mac) key as you choose Fit Line on any one of the resulting analysis and you'll add the Fit Line across all of them.
Here's an example with Big Class:
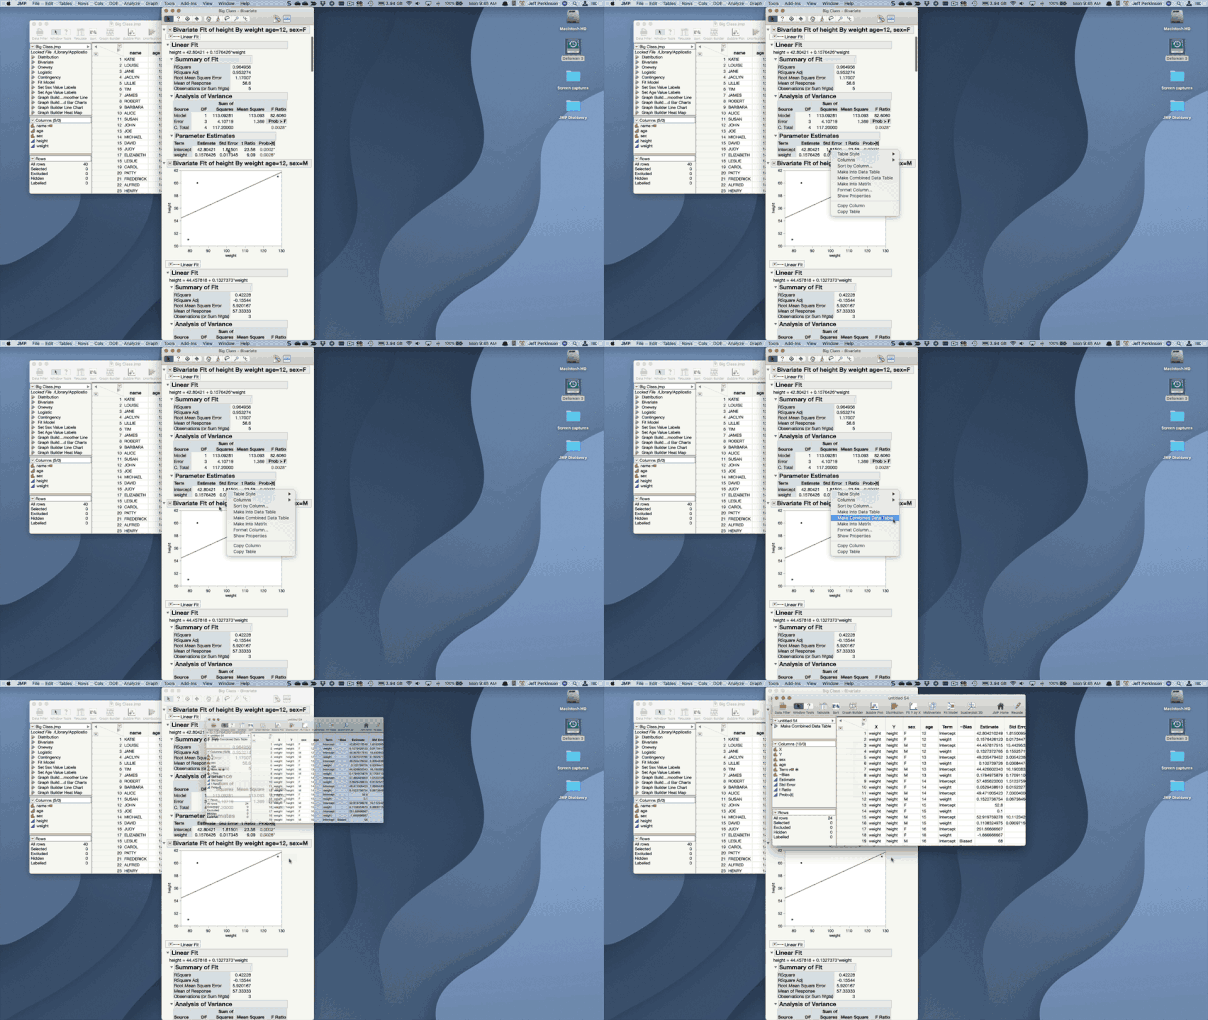
Additionally, for any table in a report window you can right click and choose Make into Data Table to create a data table out of the report table, or Make Combined Data Table to make a data table from all similar tables in the window.
Let us know if you need further help.
- Mark as New
- Bookmark
- Subscribe
- Mute
- Subscribe to RSS Feed
- Get Direct Link
- Report Inappropriate Content
Re: Extracting many linear regression fits (including confidence intervals) without using scripting
Doing it one by one felt like I was doing it wrong, and I was right!
Using ctrl whilst doing the line fit and adding the upper and lower limits to the table significantly sped things up!
The combined table also is a really nice feature that I already discovered today.
- Mark as New
- Bookmark
- Subscribe
- Mute
- Subscribe to RSS Feed
- Get Direct Link
- Report Inappropriate Content
Re: Extracting many linear regression fits (including confidence intervals) without using scripting
This is the most useful post i have ever come across!! Wow what a help!
Recommended Articles
- © 2026 JMP Statistical Discovery LLC. All Rights Reserved.
- Terms of Use
- Privacy Statement
- Contact Us


