- New to JMP? Let the Data Analysis Director guide you through selecting an analysis task, an analysis goal, and a data type. Available now in the JMP Marketplace!
- See how to install JMP Marketplace extensions to customize and enhance JMP.
- Subscribe to RSS Feed
- Mark Topic as New
- Mark Topic as Read
- Float this Topic for Current User
- Bookmark
- Subscribe
- Mute
- Printer Friendly Page
Discussions
Solve problems, and share tips and tricks with other JMP users.- JMP User Community
- :
- Discussions
- :
- Re: Dashboard window
- Mark as New
- Bookmark
- Subscribe
- Mute
- Subscribe to RSS Feed
- Get Direct Link
- Report Inappropriate Content
Dashboard window
hello,
I've a cript to make a dashboard 3x2.
When the script run, I would like to have the dashboard in a full screen , not in a small window.
How can I do it?
best regards
- Mark as New
- Bookmark
- Subscribe
- Mute
- Subscribe to RSS Feed
- Get Direct Link
- Report Inappropriate Content
Re: Dashboard window
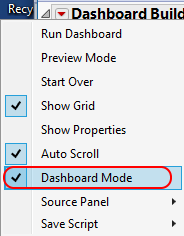
I generally find it easier to add the script from the GUI interface. The scripts are usually hidden in Dashboard Mode, but you can switch to Application Builder using the option in the red-triangle menu:
Then you can switch to the "Scripts" tab for Module1 and enter the script there:
I've attached a sample Dashboard that demonstrates this.
- Mark as New
- Bookmark
- Subscribe
- Mute
- Subscribe to RSS Feed
- Get Direct Link
- Report Inappropriate Content
Re: Dashboard window
Hello,
It's GOOD!
thanks
- Mark as New
- Bookmark
- Subscribe
- Mute
- Subscribe to RSS Feed
- Get Direct Link
- Report Inappropriate Content
Re: Dashboard window
Hello
I've an another question:
I've sent to a collegue who has JMP a script to build a dashboard.
on my computer, all was Ok: I can see the graphs.
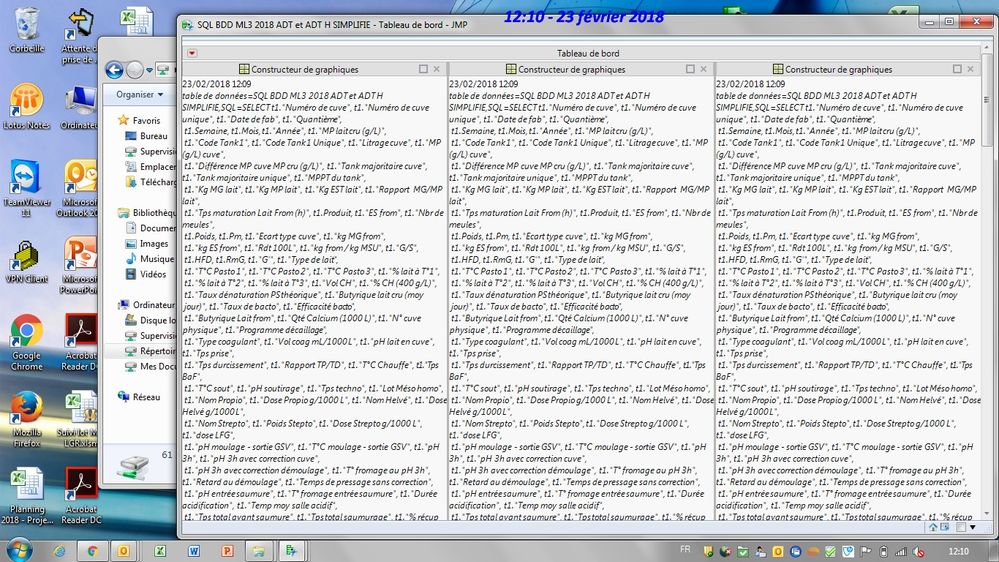
but on his computer, he can't see it; See his screen.he has access to all files for the dashboard.
Why can't he see the graphs?

- Mark as New
- Bookmark
- Subscribe
- Mute
- Subscribe to RSS Feed
- Get Direct Link
- Report Inappropriate Content
Re: Dashboard window
It looks like your colleague has turned on the Report preferences for "Date Title on Output" and "Data Table Title on Output". The latter option in this case is showing not only the data table name but also the additional text including the full SQL for the source of the table. We will look into this further to see what improvements can be made, but I think the solution for now would be to turn this option off in Preferences. I think the graphs are being stretched down to a size of 0 or possibly clipped, because the text is very large and is not stretchable.
- Mark as New
- Bookmark
- Subscribe
- Mute
- Subscribe to RSS Feed
- Get Direct Link
- Report Inappropriate Content
Re: Dashboard window
hello,
you are right.
For my computer,if I have only the option "Data Table Title on Output" turned on, I have the same sreen than my colleague: only the text, not the graphs.
Thanks!
- Mark as New
- Bookmark
- Subscribe
- Mute
- Subscribe to RSS Feed
- Get Direct Link
- Report Inappropriate Content
Re: Dashboard window
Report7 = Platform(
					DataTable1,
					Graph Builder(
						Size( 333, 214 ),
						Show Control Panel( 0 ),
						Fit to Window( "On" ),
						Variables(
							X( :Quantième ),
							Y( :pH 3h ),
							Group Y( :Type de lait ),
							Overlay( :Produit )
						),
						Elements(
							Points( X, Y, Legend( 1 ) ),
							Caption Box( X, Y, Legend( 3 ) )
						),
						SendToReport(
							Dispatch(
								{},
								"Quantième",
								ScaleBox,
								{Label Row( Show Major Grid( 1 ) )}
							),
							Dispatch(
								{},
								"pH 3h",
								ScaleBox,
								{Format( "Fixed Dec", 15, 2 ), Min( 5 ), Max( 6.2 ),
								Inc( 0.05 ), Minor Ticks( 1 ),
								Add Ref Line(
									5.75,
									"Dotted",
									"Black",
									"Cible 5.75",
									2
								), Label Row( Show Major Grid( 1 ) )}
							),
							Dispatch(
								{},
								"graph title",
								TextEditBox,
								{Set Text( "pH 3h ADT T et TH par Quantième" )}
							)
						)
					)
				);
hello,
and for:
"I think the graphs are being stretched down to a size of 0 or possibly clipped, because the text is very large and is not stretchable".
Is it possible to optimize?
the text is big and on screens of different sizes, it is not nice (particular with small screens of portable computer).
extract of the dashboard script.
Report7 = Platform(
DataTable1,
Graph Builder(
Size( 333, 214 ),
Show Control Panel( 0 ),
Fit to Window( "On" ),
Variables(
X( :Quantième ),
Y( :pH 3h ),
Group Y( :Type de lait ),
Overlay( :Produit )
),
Elements(
Points( X, Y, Legend( 1 ) ),
Caption Box( X, Y, Legend( 3 ) )
),
SendToReport(
Dispatch(
{},
"Quantième",
ScaleBox,
{Label Row( Show Major Grid( 1 ) )}
),
Dispatch(
{},
"pH 3h",
ScaleBox,
{Format( "Fixed Dec", 15, 2 ), Min( 5 ), Max( 6.2 ),
Inc( 0.05 ), Minor Ticks( 1 ),
Add Ref Line(
5.75,
"Dotted",
"Black",
"Cible 5.75",
2
), Label Row( Show Major Grid( 1 ) )}
),
Dispatch(
{},
"graph title",
TextEditBox,
{Set Text( "pH 3h ADT T et TH par Quantième" )}
)
)
)
);
- Mark as New
- Bookmark
- Subscribe
- Mute
- Subscribe to RSS Feed
- Get Direct Link
- Report Inappropriate Content
Re: Dashboard window
For anyone interested in a follow-up for this issue, i can confirm that there has been work in this area in the JMP 17 development cycle. JMP 17 will be available in Fall of 2022. Thank you for reporting this issue.
- « Previous
-
- 1
- 2
- Next »
Recommended Articles
- © 2026 JMP Statistical Discovery LLC. All Rights Reserved.
- Terms of Use
- Privacy Statement
- Contact Us


