- See how to interactively organize and restructure data for analysis. Register for May 29 webinar, 2pm US ET.
- Subscribe to RSS Feed
- Mark Topic as New
- Mark Topic as Read
- Float this Topic for Current User
- Bookmark
- Subscribe
- Mute
- Printer Friendly Page
Discussions
Solve problems, and share tips and tricks with other JMP users.- JMP User Community
- :
- Discussions
- :
- Creating an Interactive Pareto Plot with interactive Slider Boxes to update colu...

- Mark as New
- Bookmark
- Subscribe
- Mute
- Subscribe to RSS Feed
- Get Direct Link
- Report Inappropriate Content
Creating an Interactive Pareto Plot with interactive Slider Boxes to update column formula
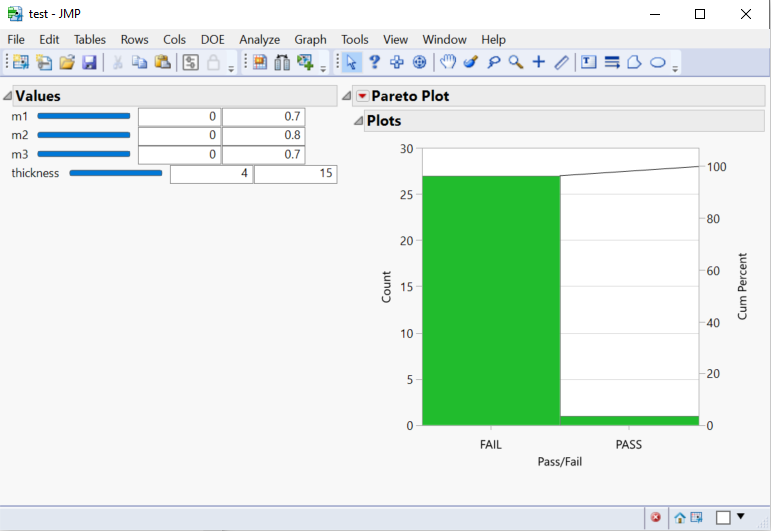
I have a set of specifications that a product in production would need to pass. I have a column with a formula that specifies the values needed (Limits) by each specification, and creates a binary pass/fail. This formula is used to create a Pareto Graph of passing number and percentage. I want to create an interactive Pareto Graph with slider boxes to adjust the testing limits, and see how changing these limits would change the amount of items passing/failing the test.
My main two problems are as follows:
1) There are multiple product types that will be tested. I wont have a consistent number of specifications per product, so I plan on inserting these specs into an list,(in the code attached that would be "spec") and using an external data table to fill in those specs for the desired product. This isn't something I need help with, but is something to consider as I will have to input slider boxes, number boxes, and so on in a for loop without directly referencing the variables.
2) I need an array of variables (spec limits) so that I can update the formula for testing purposes. Again this will need to be in a for loop. As the script stands right now, it appears the values of spec limits are not updating the in the formula for the pass/fail column. When the slider box receives the << inval command and the graph refreshes, nothing is happening as the actual pass/fail column isn't updated. I'm currently using an associative array to store the spec limits. This may not be the correct way to do this.
I have attached the sample data table I am using as well as the current script. Thanks!
Names default to here(1);
RangeMin = Associative array(["m1" => 0,
"m2" => 0,
"m3" => 0,
"thickness" => 0]);
RangeMax = Associative array(["m1" => 1,
"m2" =>1,
"m3" => 1,
"thickness" => 20]);
limit = Associative array(["m1" => 0.5,
"m2" => 0.5,
"m3" => 0,
"thickness" => 4]);

SliderVars = {0.5,0.5,0.5,10};

spec = {"m1","m2","m3","thickness"};
GraphingTable = current data table();

finalDisplay = New Window ("test", testlist = h list box());
:name("Pass/Fail") <<  Set Formula(
			if((:thickness >=  limit["thickness"] & :m3 >= limit["m3"] & m2 >= limit["m2"] & m1 >= limit["m1"]), "Pass", "Fail" )
			);
PP= Graphing Table << Pareto Plot( Cause( :"Pass/Fail"n ) );

ValuesOutlineBox = Outline Box ( "Values", SliderList = v list box());
For(i=1, i<= n items(spec),i++,

	SliderList << append(
		h list box(
			Text box(spec[i]),
			testing = spec[i];

			eval(
				parse(
					eval insert(
							"Var^char(i)^ = ^SliderVars[i]^;

							SB^char(i)^ = Slider Box(
							^RangeMin << get value(spec[i])^,
							^RangeMax << get value(spec[i])^,
							Var^char(i)^,
							NEB^char(i)^ << set( Var^char(i)^ );
							limit[testing] = Var^char(i)^;
							testlist[2] << Delete Box();
							wait(0.1);
							testlist << append(report(PP));
						);"
					);
				);
			),
			testing = spec[i];

			eval(
				parse(
					eval insert(
							"NEB^char(i)^ = Number Edit Box( Var^char(i)^,
								<< set function(
									Function( {this},
									Var^char(i)^ = this << get;
									SB^char(i)^ << inval;
									limit[testing] = Var^char(i)^;
									testlist[2] << Delete Box();
									wait(0.1);
									testlist << append(report(PP));
									)
								)


							);"


					);
				);
			),


		)
	)
);

testlist << append(ValuesOutlineBox);
testlist << append(report(PP));- Tags:
- windows
Accepted Solutions

- Mark as New
- Bookmark
- Subscribe
- Mute
- Subscribe to RSS Feed
- Get Direct Link
- Report Inappropriate Content
Re: Creating an Interactive Pareto Plot with interactive Slider Boxes to update column formula
Code is fairly heavily modified and I'm not 100% sure how reliable this will be, but I would use set function and child/sib/parent to get correct references related to the slider boxes. Also pareto seems to get updated when formula value updates. This might benefit from some usage of Eval(EvalExpr())
Names Default To Here(1);

specs = Associative Array();
specs["m1"] = {0, 0.5, 1};
specs["m2"] = {0, 0.5, 1};
specs["m3"] = {0, 0, 1};
specs["thickness"] = {0, 4, 20};

GraphingTable = Current Data Table();
Column(GraphingTable, "Pass/Fail") << Set Formula(
	If((:thickness >= specs["thickness"][2] & :m3 >= specs["m3"][2] & m2 >= specs["m2"][2] & m1 >= specs["m1"][2]),
		"Pass",
		"Fail"
	)
);

nw = New Window("test", testlist = H List Box(
	ValuesOutlineBox = Outline Box("Values", SliderList = V List Box()),
	Graphing Table << Pareto Plot(Cause(:"Pass/Fail"n))
));

filler = {};
For Each({{spec_name, spec_list, idx}}, specs,
	new_control = H List Box(
		Text Box(spec_name),
		Slider Box(spec_list[1], spec_list[3], 0, << Set Function(function({this},
			(this << Sib) << Set(this << get, run Script(1));
		))),
		Number Edit Box(spec_list[2], << Set Minimum(spec_list[1]), << Set Maximum(spec_list[3]), << Set Function(function({this},
			(this << Prev Sib) << Set(this << get);
			specs[((this << parent) << child) << get text][2] = this << get;
			Column(GraphingTable, "Pass/Fail") << Eval Formula;
		)));
	);
	SliderList << Append(new_control);
);
In your code it seems like you might be missing ^ around testing to get values in limit associative array updated.
- Mark as New
- Bookmark
- Subscribe
- Mute
- Subscribe to RSS Feed
- Get Direct Link
- Report Inappropriate Content
Re: Creating an Interactive Pareto Plot with interactive Slider Boxes to update column formula
I would use Range Slider Box, but it seems to be not working properly with associative array and list as fourth argument (I will send email to support tomorrow about this). So I would go back to Slider boxes.
This is now using formula expression and double slider boxes (it is fairly easy to break scripts like this which depend on variable names in windows, so you might have to add namespaces or something else for those)
Names Default To Here(1);
//declare associative array for specs
specs = Associative Array();

//open limits file in JMP
LimitsTable = open("vinyl data limits.jmp", invisible);
//set testing data to be able to manipulate in JMP
GraphingTable = open("Vinyl Data.jmp");
//Select the Specs you want to compare by using a COL LIST BOX
ListNumericCols = GraphingTable << Get Column Names(numeric);
nw = New Window("Select Wanted Specifications", << Modal, << return result,
	clb = Col List Box (<< Set Items (ListNumericCols))
);

ListSpecNames = nw["clb"];
show(ListSpecNames);
//insert spec names into associative array
for (i=1,i< (N Items(ListSpecNames) + 1), i++,

	Insert Into(specs, ListSpecNames[i]);
	ColSpec = Column(LimitsTable, 1); //1 is the coolumn for spec name

	LimitList= {};

	//Insert Lower Limit onto
	for(j=1, j < (nrows(LimitsTable)+1), j++,

		if (ColSpec[j] == ListSpecNames[i],
		ColLimit = Column(LimitsTable, 2);//2 is the column for lower limit
		MinVal = 0;
		if(ColLimit[j] > 0, MinVal = ColLimit[j] / 2, MinVal = ColLimit[j]*2);
		InsertInto(LimitList, MinVal );
		break();
	));
	for(k=1, k < (nrows(LimitsTable)+1), k++,

		if (ColSpec[k] == ListSpecNames[i],
		ColLimit = Column(LimitsTable, 2);//2 is the column for lower limit
		InsertInto(LimitList, ColLimit[k]);
		break();
	));
	for(l=1, l < (nrows(LimitsTable)+1), l++,

		if (ColSpec[l] == ListSpecNames[i],
		ColLimit = Column(LimitsTable, 3);//3 is the column for lower limit
		InsertInto(LimitList, ColLimit[l]);
		break();
	));
	for(m = 1, m < (nrows(LimitsTable)+1), m++,
		if (ColSpec[m] == ListSpecNames[i],
		ColLimit = Column(LimitsTable, 3);//3 is the column for upper limit
		MaxVal = 0;
		if(ColLimit[m] > 0, MaxVal = ColLimit[m] *2, MaxVal = ColLimit[m] /2 );
		InsertInto(LimitList, MaxVal );
		break();
		)
	);
	show (LimitList);

	specs[ListSpecNames[i]] = LimitList
);

//show(specs); for debugging and making sure specs array is being populated
//sel_specs = Associative Array(ListSpecNames);
//specs << Intersect(sel_specs);


//*******************************************************************
//Create Pass Fail column if not existing.
if(!contains(GraphingTable << Get Column Names("String"), "Pass/Fail"),
	GraphingTable << new column("Pass/Fail", Character);
);

//using a string to insert a formula into the row that can be called upon dynamically
formula_expr = Expr(
	f = "If(All(";
	For Each({{spec, limits}}, specs,
		f ||= Eval Insert("^limits[2]^ < :^spec^ < ^limits[3]^ & ");
	);
	//drop last &
	f = Left(f, Length(f) - 3);
	f ||= "),"; // close all
	f ||= "\!N\!t\!"PASS\!",\!"FAIL\!"
	)";

	Eval(EvalExpr(Column(GraphingTable, "Pass/Fail") << Set Formula(
		Expr(Parse(f));
	)));
);
formula_expr;

nw2 = New Window("test", testlist = H List Box(
	ValuesOutlineBox = Outline Box("Values", SliderList = V List Box()),
	Graphing Table << Pareto Plot(Cause(:"Pass/Fail"n))
));

For Each({{spec_name, spec_list, idx}}, specs,
	new_control = H List Box(
		Text Box(spec_name),
		rsb = Slider Box(spec_list[1], spec_list[4]),
		Number Edit Box(spec_list[2], << Set Minimum(spec_list[1]), << Set Maximum(spec_list[4]), << Set Function(function({this},
			(this << Prev Sib) << Set(this << get);
			formula_expr;
		)))
	);
	Eval(EvalExpr(rsb << Set Var(specs[Expr(spec_name)][2])));
	rsb << Set Function(function({this},
		(this << sib) << Set(this << Get, Run Script(1));
	));
	SliderList << Append(new_control);
);

For Each({{spec_name, spec_list, idx}}, specs,
	new_control = H List Box(
		Text Box(spec_name),
		rsb = Slider Box(spec_list[1], spec_list[4]),
		Number Edit Box(spec_list[2], << Set Minimum(spec_list[1]), << Set Maximum(spec_list[4]), << Set Function(function({this},
			(this << Prev Sib) << Set(this << get);
			formula_expr;
		)))
	);
	Eval(EvalExpr(rsb << Set Var(specs[Expr(spec_name)][3])));
	rsb << Set Function(function({this},
		(this << sib) << Set(this << Get, Run Script(1));
	));
	SliderList << Append(new_control);
);
Example of the issue:
Names Default To Here(1);
var1 = 1;
var2 = 2;
var3 = 2;
var4 = 1;
aa = ["low" => 1, "up" => 2];
l = {};
l[1] = 1;
l[2] = 2;

nw = New window("test",
	rsb1 = Range Slider Box(1, 2, var1, var2, Show(1)),
	rsb2 = Range Slider Box(1, 2, aa["low"], aa["up"]),
	rsb2_1 = Range Slider Box(1, 2, aa["low"], var3),
	rsb1_2 = Range Slider Box(1, 2, var4, aa["up"]),
	rsb3 = Range Slider Box(1, 2, l[1], l[2]),
);
Show(rsb1 << Get Lower Var, rsb1 << Get Upper Var);
Show(rsb2 << Get Lower Var, rsb2 << Get Upper Var);
Show(rsb2_1 << Get Lower Var, rsb2_1 << Get Upper Var);
Show(rsb1_2 << Get Lower Var, rsb1_2 << Get Upper Var);
Show(rsb3 << Get Lower Var, rsb3 << Get Upper Var);

Eval(EvalExpr(rsb3 << Set Lower Var(Expr(Expr(l[1])))));
Eval(EvalExpr(rsb3 << Set Upper Var(Expr(Expr(l[2])))));
Show(rsb3 << Get Lower Var, rsb3 << Get Upper Var);
- Mark as New
- Bookmark
- Subscribe
- Mute
- Subscribe to RSS Feed
- Get Direct Link
- Report Inappropriate Content
Re: Creating an Interactive Pareto Plot with interactive Slider Boxes to update column formula
Code is fairly heavily modified and I'm not 100% sure how reliable this will be, but I would use set function and child/sib/parent to get correct references related to the slider boxes. Also pareto seems to get updated when formula value updates. This might benefit from some usage of Eval(EvalExpr())
Names Default To Here(1);

specs = Associative Array();
specs["m1"] = {0, 0.5, 1};
specs["m2"] = {0, 0.5, 1};
specs["m3"] = {0, 0, 1};
specs["thickness"] = {0, 4, 20};

GraphingTable = Current Data Table();
Column(GraphingTable, "Pass/Fail") << Set Formula(
	If((:thickness >= specs["thickness"][2] & :m3 >= specs["m3"][2] & m2 >= specs["m2"][2] & m1 >= specs["m1"][2]),
		"Pass",
		"Fail"
	)
);

nw = New Window("test", testlist = H List Box(
	ValuesOutlineBox = Outline Box("Values", SliderList = V List Box()),
	Graphing Table << Pareto Plot(Cause(:"Pass/Fail"n))
));

filler = {};
For Each({{spec_name, spec_list, idx}}, specs,
	new_control = H List Box(
		Text Box(spec_name),
		Slider Box(spec_list[1], spec_list[3], 0, << Set Function(function({this},
			(this << Sib) << Set(this << get, run Script(1));
		))),
		Number Edit Box(spec_list[2], << Set Minimum(spec_list[1]), << Set Maximum(spec_list[3]), << Set Function(function({this},
			(this << Prev Sib) << Set(this << get);
			specs[((this << parent) << child) << get text][2] = this << get;
			Column(GraphingTable, "Pass/Fail") << Eval Formula;
		)));
	);
	SliderList << Append(new_control);
);
In your code it seems like you might be missing ^ around testing to get values in limit associative array updated.
- Mark as New
- Bookmark
- Subscribe
- Mute
- Subscribe to RSS Feed
- Get Direct Link
- Report Inappropriate Content
Re: Creating an Interactive Pareto Plot with interactive Slider Boxes to update column formula
Thank you so much! This is my second week scripting in JSL and you have no idea how much you helped me.
- Mark as New
- Bookmark
- Subscribe
- Mute
- Subscribe to RSS Feed
- Get Direct Link
- Report Inappropriate Content
Re: Creating an Interactive Pareto Plot with interactive Slider Boxes to update column formula
I very much appreciate the help you have given over the past few days. I have been working through your solutions to this as well as my other post,Having a column formula update based on a associative array referenced by a list.
I've looked through and tried to work out the parse and eval expressions and am getting an understanding of how that works in jsl. I am having an issue with combining the two Ideas. I realized that it would be better to have 4 indices in the associative array to store specs.In the format "spec" => {<Lowest allowed tolerance>, <Lower Limit of spec>, <higher limit of spec>, <Maximum allowed tolerance>}. Thanks to your help with the parsing, the script below now creates this array and a Pass/Fail column to see if all specs are met. The goal being to loosen tolerances in the limits, up to lowest or maximum tolerances in order to obtain the new desired passing yield rate of product, and updating the pareto chart as you fixed above. I have tried implementing a range slider box, as this would be more intuitive for relaxing tolerances on limits, but am having trouble. It also breaks the pareto plot auto updating as before.
I believe one problem might be that because "f" string is being defined initially, I do not think that it will update for future executions of setting the formula for the pass fail column. Any way you might be able to help would be greatly appreciated.
Names Default To Here(1);
//declare associative array for specs
specs = Associative Array();

//open limits file in JMP
LimitsTable = open("vinyl data limits.jmp", invisible);
//set testing data to be able to manipulate in JMP
GraphingTable = open("Vinyl Data.jmp");
//Select the Specs you want to compare by using a COL LIST BOX
ListNumericCols = GraphingTable << Get Column Names(numeric);
nw = New Window("Select Wanted Specifications", << Modal, << return result,
	clb = Col List Box (<< Set Items (ListNumericCols))
);

ListSpecNames = nw["clb"];
show(ListSpecNames);
//insert spec names into associative array
for (i=1,i< (N Items(ListSpecNames) + 1), i++,

	Insert Into(specs, ListSpecNames[i]);
	ColSpec = Column(LimitsTable, 1); //1 is the coolumn for spec name

	LimitList= {};

	//Insert Lower Limit onto
	for(j=1, j < (nrows(LimitsTable)+1), j++,

		if (ColSpec[j] == ListSpecNames[i],
		ColLimit = Column(LimitsTable, 2);//2 is the column for lower limit
		MinVal = 0;
		if(ColLimit[j] > 0, MinVal = ColLimit[j] / 2, MinVal = ColLimit[j]*2);
		InsertInto(LimitList, MinVal );
		break();
	));
	for(k=1, k < (nrows(LimitsTable)+1), k++,

		if (ColSpec[k] == ListSpecNames[i],
		ColLimit = Column(LimitsTable, 2);//2 is the column for lower limit
		InsertInto(LimitList, ColLimit[k]);
		break();
	));
	for(l=1, l < (nrows(LimitsTable)+1), l++,

		if (ColSpec[l] == ListSpecNames[i],
		ColLimit = Column(LimitsTable, 3);//3 is the column for lower limit
		InsertInto(LimitList, ColLimit[l]);
		break();
	));
	for(m = 1, m < (nrows(LimitsTable)+1), m++,
		if (ColSpec[m] == ListSpecNames[i],
		ColLimit = Column(LimitsTable, 3);//3 is the column for upper limit
		MaxVal = 0;
		if(ColLimit[m] > 0, MaxVal = ColLimit[m] *2, MaxVal = ColLimit[m] /2 );
		InsertInto(LimitList, MaxVal );
		break();
		)
	);
	show (LimitList);

	specs[ListSpecNames[i]] = LimitList
);

//show(specs); for debugging and making sure specs array is being populated
//sel_specs = Associative Array(ListSpecNames);
//specs << Intersect(sel_specs);


//*******************************************************************
//Create Pass Fail column if not existing.
if(!contains(GraphingTable << Get Column Names("String"), "Pass/Fail"),
	GraphingTable << new column("Pass/Fail", Character);
);

//using a string to insert a formula into the row that can be called upon dynamically
f = "If(All(";
For Each({{spec, limits}}, specs,
	f ||= Eval Insert("^limits[2]^ < :^spec^ < ^limits[3]^ & ");
);

//drop last &
f = Left(f, Length(f) - 3);
f ||= "),"; // close all
f ||= "\!N\!t\!"PASS\!",\!"FAIL\!"
)";

Eval(EvalExpr(Column(GraphingTable, "Pass/Fail") << Set Formula(
	Expr(Parse(f));
)));

nw2 = New Window("test", testlist = H List Box(
	ValuesOutlineBox = Outline Box("Values", SliderList = V List Box()),
	Graphing Table << Pareto Plot(Cause(:"Pass/Fail"n))
));

filler = {};
For Each({{spec_name, spec_list, idx}}, specs,
	new_control = H List Box(
		Text Box(spec_name),
		Range Slider Box(spec_list[1], spec_list[4] , spec_list[2], spec_list[3], << Set Function(function({this},
			(this << Sib) << Set(this << get, run Script(1));
		)))  ,
		Number Edit Box(spec_list[2], << Set Minimum(spec_list[1]), << Set Maximum(spec_list[4]), << Set Function(function({this},
			(this << Prev Sib) << Set(this << get);
			specs[((this << parent) << child) << get text][2] = this << get;
			Column(GraphingTable, "Pass/Fail") << Eval Formula;
		))),
		Number Edit Box(spec_list[3], << Set Minimum(spec_list[1]), << Set Maximum(spec_list[4]), << Set Function(function({this},
			(this << Prev Sib) << Set(this << get);
			specs[((this << parent) << child) << get text][3] = this << get;
			Column(GraphingTable, "Pass/Fail") << Eval Formula;
		)))
	);
	SliderList << Append(new_control);
);
- Mark as New
- Bookmark
- Subscribe
- Mute
- Subscribe to RSS Feed
- Get Direct Link
- Report Inappropriate Content
Re: Creating an Interactive Pareto Plot with interactive Slider Boxes to update column formula
For the formula you have at least two options: you could use expression to update the value in formula which you run every time specs is updated or modify the formula to use spec associative array
f = "If(All(";
For Each({{spec, limits}}, specs,
	f ||= Eval Insert("specs[\!"^spec^\!"][2] < :^spec^ < specs[\!"^spec^\!"][3] & ");
);

//drop last &
f = Left(f, Length(f) - 3);
f ||= "),"; // close all
f ||= "\!N\!t\!"PASS\!",\!"FAIL\!"
)";
Range Slider Box is even messier than Slider Box so working around the issues with that is bigger challenge. I wouldn't most likely even bother with Eval(EvalExpr()) and I would just use Eval(Parse()) and try to get correct references there. I would start with only Ranger Slider Box and after I got those working I would add Number Edit Boxes one at the time (Range Slider Boxes fourth argument might be a bit buggy...)
- Mark as New
- Bookmark
- Subscribe
- Mute
- Subscribe to RSS Feed
- Get Direct Link
- Report Inappropriate Content
Re: Creating an Interactive Pareto Plot with interactive Slider Boxes to update column formula
Do you think It would work better to have two slider boxes, one for the upper and one for the lower limit of each specification vs dealing with the arguments of the range slider boxes? Testing yesterday yielded many more issues with range slider boxes with much less documentation on arguments of the box type. I think it would fix the range box issue, but might complicate the formula part.

- Mark as New
- Bookmark
- Subscribe
- Mute
- Subscribe to RSS Feed
- Get Direct Link
- Report Inappropriate Content
Re: Creating an Interactive Pareto Plot with interactive Slider Boxes to update column formula
I would use Range Slider Box, but it seems to be not working properly with associative array and list as fourth argument (I will send email to support tomorrow about this). So I would go back to Slider boxes.
This is now using formula expression and double slider boxes (it is fairly easy to break scripts like this which depend on variable names in windows, so you might have to add namespaces or something else for those)
Names Default To Here(1);
//declare associative array for specs
specs = Associative Array();

//open limits file in JMP
LimitsTable = open("vinyl data limits.jmp", invisible);
//set testing data to be able to manipulate in JMP
GraphingTable = open("Vinyl Data.jmp");
//Select the Specs you want to compare by using a COL LIST BOX
ListNumericCols = GraphingTable << Get Column Names(numeric);
nw = New Window("Select Wanted Specifications", << Modal, << return result,
	clb = Col List Box (<< Set Items (ListNumericCols))
);

ListSpecNames = nw["clb"];
show(ListSpecNames);
//insert spec names into associative array
for (i=1,i< (N Items(ListSpecNames) + 1), i++,

	Insert Into(specs, ListSpecNames[i]);
	ColSpec = Column(LimitsTable, 1); //1 is the coolumn for spec name

	LimitList= {};

	//Insert Lower Limit onto
	for(j=1, j < (nrows(LimitsTable)+1), j++,

		if (ColSpec[j] == ListSpecNames[i],
		ColLimit = Column(LimitsTable, 2);//2 is the column for lower limit
		MinVal = 0;
		if(ColLimit[j] > 0, MinVal = ColLimit[j] / 2, MinVal = ColLimit[j]*2);
		InsertInto(LimitList, MinVal );
		break();
	));
	for(k=1, k < (nrows(LimitsTable)+1), k++,

		if (ColSpec[k] == ListSpecNames[i],
		ColLimit = Column(LimitsTable, 2);//2 is the column for lower limit
		InsertInto(LimitList, ColLimit[k]);
		break();
	));
	for(l=1, l < (nrows(LimitsTable)+1), l++,

		if (ColSpec[l] == ListSpecNames[i],
		ColLimit = Column(LimitsTable, 3);//3 is the column for lower limit
		InsertInto(LimitList, ColLimit[l]);
		break();
	));
	for(m = 1, m < (nrows(LimitsTable)+1), m++,
		if (ColSpec[m] == ListSpecNames[i],
		ColLimit = Column(LimitsTable, 3);//3 is the column for upper limit
		MaxVal = 0;
		if(ColLimit[m] > 0, MaxVal = ColLimit[m] *2, MaxVal = ColLimit[m] /2 );
		InsertInto(LimitList, MaxVal );
		break();
		)
	);
	show (LimitList);

	specs[ListSpecNames[i]] = LimitList
);

//show(specs); for debugging and making sure specs array is being populated
//sel_specs = Associative Array(ListSpecNames);
//specs << Intersect(sel_specs);


//*******************************************************************
//Create Pass Fail column if not existing.
if(!contains(GraphingTable << Get Column Names("String"), "Pass/Fail"),
	GraphingTable << new column("Pass/Fail", Character);
);

//using a string to insert a formula into the row that can be called upon dynamically
formula_expr = Expr(
	f = "If(All(";
	For Each({{spec, limits}}, specs,
		f ||= Eval Insert("^limits[2]^ < :^spec^ < ^limits[3]^ & ");
	);
	//drop last &
	f = Left(f, Length(f) - 3);
	f ||= "),"; // close all
	f ||= "\!N\!t\!"PASS\!",\!"FAIL\!"
	)";

	Eval(EvalExpr(Column(GraphingTable, "Pass/Fail") << Set Formula(
		Expr(Parse(f));
	)));
);
formula_expr;

nw2 = New Window("test", testlist = H List Box(
	ValuesOutlineBox = Outline Box("Values", SliderList = V List Box()),
	Graphing Table << Pareto Plot(Cause(:"Pass/Fail"n))
));

For Each({{spec_name, spec_list, idx}}, specs,
	new_control = H List Box(
		Text Box(spec_name),
		rsb = Slider Box(spec_list[1], spec_list[4]),
		Number Edit Box(spec_list[2], << Set Minimum(spec_list[1]), << Set Maximum(spec_list[4]), << Set Function(function({this},
			(this << Prev Sib) << Set(this << get);
			formula_expr;
		)))
	);
	Eval(EvalExpr(rsb << Set Var(specs[Expr(spec_name)][2])));
	rsb << Set Function(function({this},
		(this << sib) << Set(this << Get, Run Script(1));
	));
	SliderList << Append(new_control);
);

For Each({{spec_name, spec_list, idx}}, specs,
	new_control = H List Box(
		Text Box(spec_name),
		rsb = Slider Box(spec_list[1], spec_list[4]),
		Number Edit Box(spec_list[2], << Set Minimum(spec_list[1]), << Set Maximum(spec_list[4]), << Set Function(function({this},
			(this << Prev Sib) << Set(this << get);
			formula_expr;
		)))
	);
	Eval(EvalExpr(rsb << Set Var(specs[Expr(spec_name)][3])));
	rsb << Set Function(function({this},
		(this << sib) << Set(this << Get, Run Script(1));
	));
	SliderList << Append(new_control);
);
Example of the issue:
Names Default To Here(1);
var1 = 1;
var2 = 2;
var3 = 2;
var4 = 1;
aa = ["low" => 1, "up" => 2];
l = {};
l[1] = 1;
l[2] = 2;

nw = New window("test",
	rsb1 = Range Slider Box(1, 2, var1, var2, Show(1)),
	rsb2 = Range Slider Box(1, 2, aa["low"], aa["up"]),
	rsb2_1 = Range Slider Box(1, 2, aa["low"], var3),
	rsb1_2 = Range Slider Box(1, 2, var4, aa["up"]),
	rsb3 = Range Slider Box(1, 2, l[1], l[2]),
);
Show(rsb1 << Get Lower Var, rsb1 << Get Upper Var);
Show(rsb2 << Get Lower Var, rsb2 << Get Upper Var);
Show(rsb2_1 << Get Lower Var, rsb2_1 << Get Upper Var);
Show(rsb1_2 << Get Lower Var, rsb1_2 << Get Upper Var);
Show(rsb3 << Get Lower Var, rsb3 << Get Upper Var);

Eval(EvalExpr(rsb3 << Set Lower Var(Expr(Expr(l[1])))));
Eval(EvalExpr(rsb3 << Set Upper Var(Expr(Expr(l[2])))));
Show(rsb3 << Get Lower Var, rsb3 << Get Upper Var);
- Mark as New
- Bookmark
- Subscribe
- Mute
- Subscribe to RSS Feed
- Get Direct Link
- Report Inappropriate Content
Re: Creating an Interactive Pareto Plot with interactive Slider Boxes to update column formula
Thank you. If you hear anything back about the Range Slider Box issue I would be very interested to see.
- Mark as New
- Bookmark
- Subscribe
- Mute
- Subscribe to RSS Feed
- Get Direct Link
- Report Inappropriate Content
Re: Creating an Interactive Pareto Plot with interactive Slider Boxes to update column formula
According to JMP support, JMP development deemed it as unintended behaviour and will will be addressed in a future release.
- Mark as New
- Bookmark
- Subscribe
- Mute
- Subscribe to RSS Feed
- Get Direct Link
- Report Inappropriate Content
Re: Creating an Interactive Pareto Plot with interactive Slider Boxes to update column formula
I came across another issue with this script and I was hoping to get your thoughts. If I manually enter a number into the number edit box for the specs, I want to add a button to be able to save the specs to another table. Adding the button is not an issue, but I don't know how I will be able to reference then current values of the number edit boxes. After the for each function, they are added to the V List Box, and those values are updated in the formula column. But without a way to reference the individual number edit box's values or the ability to store those numbers and enter them in the a separate data structure with a reference to the specification, I dont know how I can save these new limits in the script. Referencing the new_control H list box will only show the last box that went through the for each loop. Any thoughts or suggestions would be great.
Recommended Articles
- © 2026 JMP Statistical Discovery LLC. All Rights Reserved.
- Terms of Use
- Privacy Statement
- Contact Us