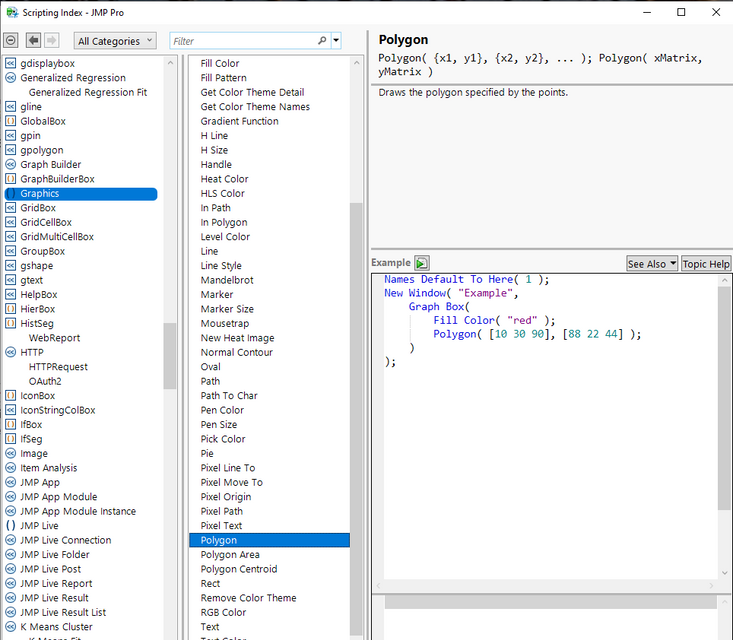
JMP allows for one to add graphics to any of the graphs and plots generated in JMP. Here is an example taken from the Scripting Index

A complete set of graphic primitives' are available Here is a listing taken from the Scripting Index

Here is the script that generated the above graph
Names Default To Here( 1 );
Open( "$SAMPLE_DATA/Big Class.jmp" );
biv = Bivariate( Y( :weight ), X( :height ), FitLine );
rbiv = biv << report;
framebox = rbiv[frame box( 1 )];
framebox <<
Add Graphics Script(
	Transparency( 0.5 );
	Fill Color( {1.0, 0.5, 0.0} );
	Polygon( [60, 72, 57], [75, 120, 120] );
);
Jim