cancel
Showing results for 
Show  only  | Search instead for 
Did you mean: 
  • Instantly extract effect sizes, F-ratios, and FDR-adjusted p-values from your models with the Calculate Effects Sizes extension, available now in the JMP Marketplace!
  • New to JMP? Join us Sept. 23-24 for the Early User Edition of Discovery Summit, tailor-made for new users. Register now for free!
  • Your voice matters! Tell us how you prefer to receive JMP updates, so we can tailor our communication to your needs. Take short survey.

Discussions

Solve problems, and share tips and tricks with other JMP users.
Choose Language Hide Translation Bar

Create a line plot (graph builder) with a partial shaded background

I have a very nice x y plot in the graph builder and now would like to add a shaded area that envelopes  the data already plotted. The envelope is not a confidence area, rather a borderline.  Any suggestions ? 

Thank you 

Harald

1 REPLY 1
txnelson
Super User

Re: Create a line plot (graph builder) with a partial shaded background

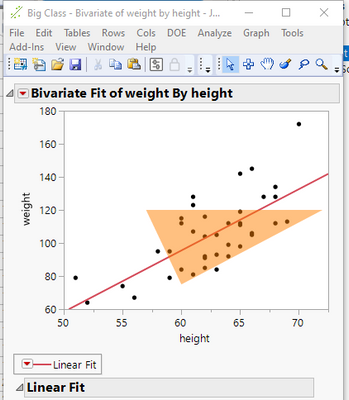
JMP allows for one to add graphics to any of the graphs and plots generated in JMP.  Here is an example taken from the Scripting Index
txnelson_0-1633074257852.png

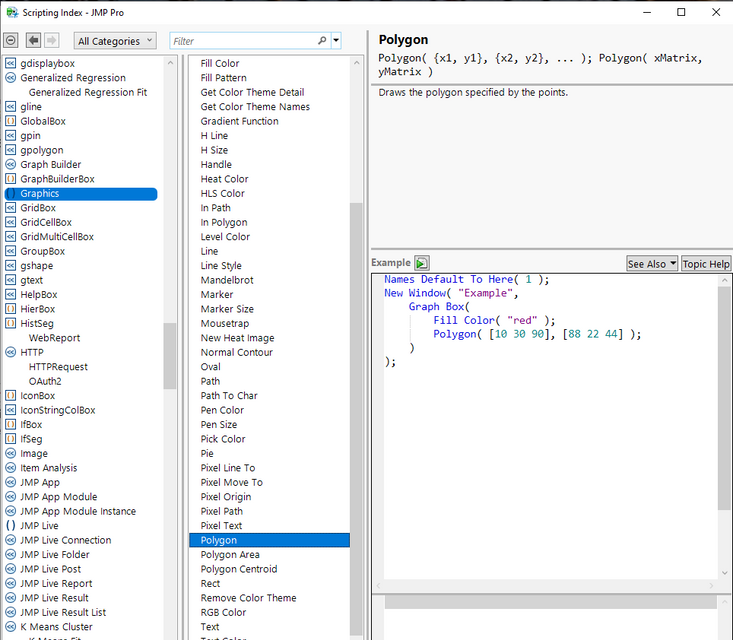
A complete set of graphic primitives' are available   Here is a listing taken from the Scripting Index
txnelson_1-1633074551512.png


Here is the script that generated the above graph

Names Default To Here( 1 );
Open( "$SAMPLE_DATA/Big Class.jmp" );
biv = Bivariate( Y( :weight ), X( :height ), FitLine );
rbiv = biv << report;
framebox = rbiv[frame box( 1 )];
framebox <<
Add Graphics Script(
	Transparency( 0.5 );
	Fill Color( {1.0, 0.5, 0.0} );
	Polygon( [60, 72, 57], [75, 120, 120] );
);


Jim

Recommended Articles