cancel
Showing results for 
Show  only  | Search instead for 
Did you mean: 
  • New to JMP? Join us Sept. 23-24 for the Early User Edition of Discovery Summit, tailor-made for new users. Register now for free!
  • Your voice matters! Tell us how you prefer to receive JMP updates, so we can tailor our communication to your needs. Take short survey.
  • See how to access JMP Marketplace - and - find, create & share add-ins to extend your JMP. Watch video.

Discussions

Solve problems, and share tips and tricks with other JMP users.
Choose Language Hide Translation Bar

Create a line plot (graph builder) with a partial shaded background

I have a very nice x y plot in the graph builder and now would like to add a shaded area that envelopes  the data already plotted. The envelope is not a confidence area, rather a borderline.  Any suggestions ? 

Thank you 

Harald

1 REPLY 1
txnelson
Super User

Re: Create a line plot (graph builder) with a partial shaded background

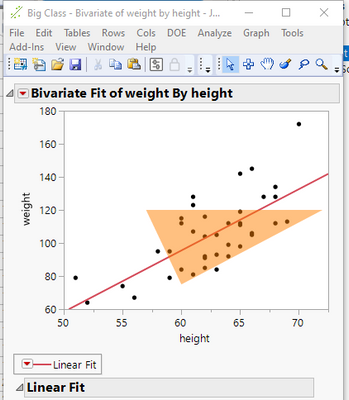
JMP allows for one to add graphics to any of the graphs and plots generated in JMP.  Here is an example taken from the Scripting Index
txnelson_0-1633074257852.png

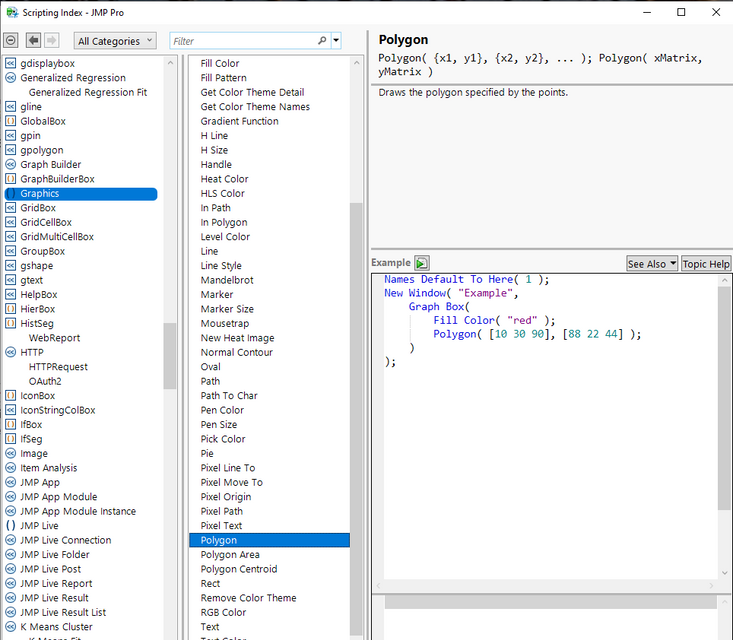
A complete set of graphic primitives' are available   Here is a listing taken from the Scripting Index
txnelson_1-1633074551512.png


Here is the script that generated the above graph

Names Default To Here( 1 );
Open( "$SAMPLE_DATA/Big Class.jmp" );
biv = Bivariate( Y( :weight ), X( :height ), FitLine );
rbiv = biv << report;
framebox = rbiv[frame box( 1 )];
framebox <<
Add Graphics Script(
	Transparency( 0.5 );
	Fill Color( {1.0, 0.5, 0.0} );
	Polygon( [60, 72, 57], [75, 120, 120] );
);


Jim

Recommended Articles