- Subscribe to RSS Feed
- Mark Topic as New
- Mark Topic as Read
- Float this Topic for Current User
- Bookmark
- Subscribe
- Mute
- Printer Friendly Page
Discussions
Solve problems, and share tips and tricks with other JMP users.- JMP User Community
- :
- Discussions
- :
- Create Dashboard and save as Interactive HTML JMP14.1.0
- Mark as New
- Bookmark
- Subscribe
- Mute
- Subscribe to RSS Feed
- Get Direct Link
- Report Inappropriate Content
Create Dashboard and save as Interactive HTML JMP14.1.0
Hi,
I created dashboard of many graphs and save as interactive HTML, using JMP 14.1.0
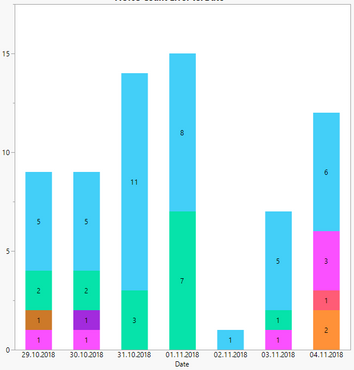
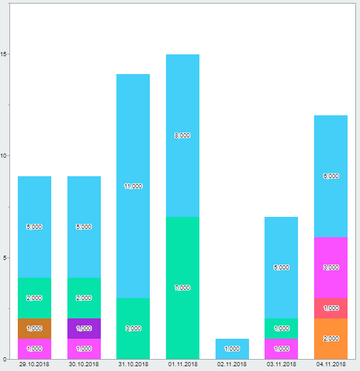
Graph in JMP looks ok but graph in Interactive HTML shows 3 decimal and I don't want this. I tried to search how to set for interactive HTML but couldn't it. Please advise.
	Elements(
		Bar( X, Y, Legend( 9 ), Bar Style( "Stacked" ), Label( "Label by Value" ) )
	),


Accepted Solutions
- Mark as New
- Bookmark
- Subscribe
- Mute
- Subscribe to RSS Feed
- Get Direct Link
- Report Inappropriate Content
Re: Create Dashboard and save as Interactive HTML JMP14.1.0
The behavior you explained could be replicated after your submission to Techincal Support. We will be reporting the behavior to Development to be addressed in a future release of JMP.
Thank you for helping us improve JMP.
- Mark as New
- Bookmark
- Subscribe
- Mute
- Subscribe to RSS Feed
- Get Direct Link
- Report Inappropriate Content
Re: Create Dashboard and save as Interactive HTML JMP14.1.0
It looks like this issue was successfully fixed in JMP 15 and later versions.
- Mark as New
- Bookmark
- Subscribe
- Mute
- Subscribe to RSS Feed
- Get Direct Link
- Report Inappropriate Content
Re: Create Dashboard and save as Interactive HTML JMP14.1.0
What Summary Statistic is selected in Graph Builder? For certain statistics we attempt to provide extra precision.
- Mark as New
- Bookmark
- Subscribe
- Mute
- Subscribe to RSS Feed
- Get Direct Link
- Report Inappropriate Content
Re: Create Dashboard and save as Interactive HTML JMP14.1.0
@josh_markwordt I used Summary Statistic 'N'.
- Mark as New
- Bookmark
- Subscribe
- Mute
- Subscribe to RSS Feed
- Get Direct Link
- Report Inappropriate Content
Re: Create Dashboard and save as Interactive HTML JMP14.1.0
Gr1 = Data table ("AOI Log Summary")<<Graph Builder(
Size( 425, 348 ),
Show Control Panel( 0 ),
Legend Position( "Bottom" ),
Variables( X( :Date ), Y( :Count Error ), Overlay( :Error ) ),
Elements(
Bar( X, Y, Legend( 9 ), Bar Style( "Stacked" ), Label( "Label by Value" ) )
),
SendToReport(
Dispatch(
{},
"400",
ScaleBox,
This is part of script.
- Mark as New
- Bookmark
- Subscribe
- Mute
- Subscribe to RSS Feed
- Get Direct Link
- Report Inappropriate Content
Re: Create Dashboard and save as Interactive HTML JMP14.1.0
@Akane please open a track with Technical Support so we can help you investigate this report further. I am particularly interested in obtaining more information about your environment.
- Mark as New
- Bookmark
- Subscribe
- Mute
- Subscribe to RSS Feed
- Get Direct Link
- Report Inappropriate Content
Re: Create Dashboard and save as Interactive HTML JMP14.1.0
@Dahlia_Watkins Hi, I opened a track with Technical Support. Please verify. Thank you.
- Mark as New
- Bookmark
- Subscribe
- Mute
- Subscribe to RSS Feed
- Get Direct Link
- Report Inappropriate Content
Re: Create Dashboard and save as Interactive HTML JMP14.1.0
The behavior you explained could be replicated after your submission to Techincal Support. We will be reporting the behavior to Development to be addressed in a future release of JMP.
Thank you for helping us improve JMP.
- Mark as New
- Bookmark
- Subscribe
- Mute
- Subscribe to RSS Feed
- Get Direct Link
- Report Inappropriate Content
Re: Create Dashboard and save as Interactive HTML JMP14.1.0
Akane, Dahlia,
If this uses Summary Statistic( "N" ), it would be worth trying in JMP 14.2.
I fixed a similar bug, though I'm not sure this is the same case.
Heman.
- Mark as New
- Bookmark
- Subscribe
- Mute
- Subscribe to RSS Feed
- Get Direct Link
- Report Inappropriate Content
Re: Create Dashboard and save as Interactive HTML JMP14.1.0
It looks like this issue was successfully fixed in JMP 15 and later versions.
Recommended Articles
- © 2026 JMP Statistical Discovery LLC. All Rights Reserved.
- Terms of Use
- Privacy Statement
- Contact Us


