- Subscribe to RSS Feed
- Mark Topic as New
- Mark Topic as Read
- Float this Topic for Current User
- Bookmark
- Subscribe
- Mute
- Printer Friendly Page
Discussions
Solve problems, and share tips and tricks with other JMP users.- JMP User Community
- :
- Discussions
- :
- Control charts automatization with spec limits based on product
- Mark as New
- Bookmark
- Subscribe
- Mute
- Subscribe to RSS Feed
- Get Direct Link
- Report Inappropriate Content
Control charts automatization with spec limits based on product
Dear community,
I perform trend analyses using control charts for different products of the same family, which share common process controls (pH, manufacturing time...), but which have different specification limits.
I would like to have just a column with common process control data (col 3 in example), and through a script apply the different spec limits by product ( i am currently using automatic control limits at 3 sigma, but would be interesting to be able to define them also)
My current way of doing it is having different columns and saving the spec limits to column properties and then having to link product 1 with time column 1, product 2 with time column 2 etc. But this creates a huge data table.
I guess it has to be using a spec limit table, but could not script the process through it either.
DT is attached
thank you
@Ben_BarrIngh @Danny_sierra
Accepted Solutions
- Mark as New
- Bookmark
- Subscribe
- Mute
- Subscribe to RSS Feed
- Get Direct Link
- Report Inappropriate Content
Re: Control charts automatization with spec limits based on product
Hi Andeka,
Thanks for posting. Will preface by saying I’m not a scripter but I’ve found a way to solve this using JMP which you can script. I’ve taken a lot of these details from the example described here: https://community.jmp.com/t5/Discussions/Setting-Spec-Limits-using-Column-Data/td-p/392499
In this solution you can store each product and process(es) control and spec limits in a separate data table, in this case I’ve made a data-table of spec limits with UCL/LCL generated from the Limit Summaries generated by the Control Chart Builder. I’ve added random USL values to demonstrate its use. If you have multiple processes that you want to analyze, you just need to note it on your ‘Process’ column (important for later).
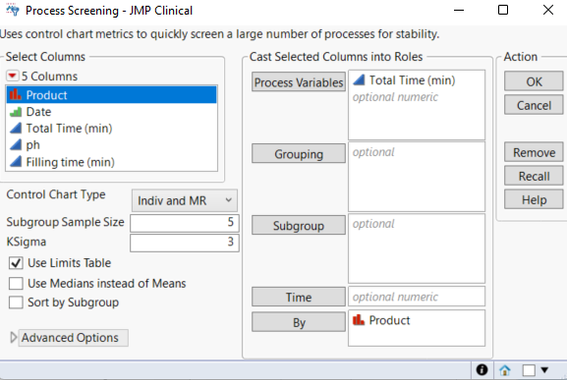
Using this data-table, you can use the Process Screening platform (Analyze>Quality and Process>Process Screening in JMP 17) to create a single ‘page’ to look at your control charts. To start, place your process control data in ‘Process Variables’ and separate your data by the product using the ‘By’ selection (see below). Make sure to select ‘Use Limits Table’ and press Okay and select your spec table.
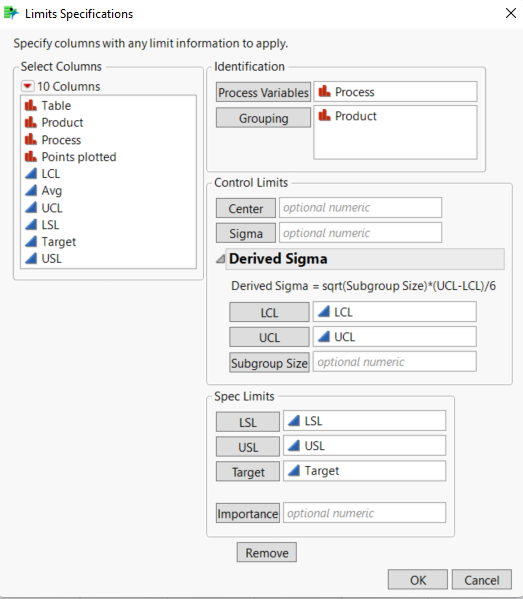
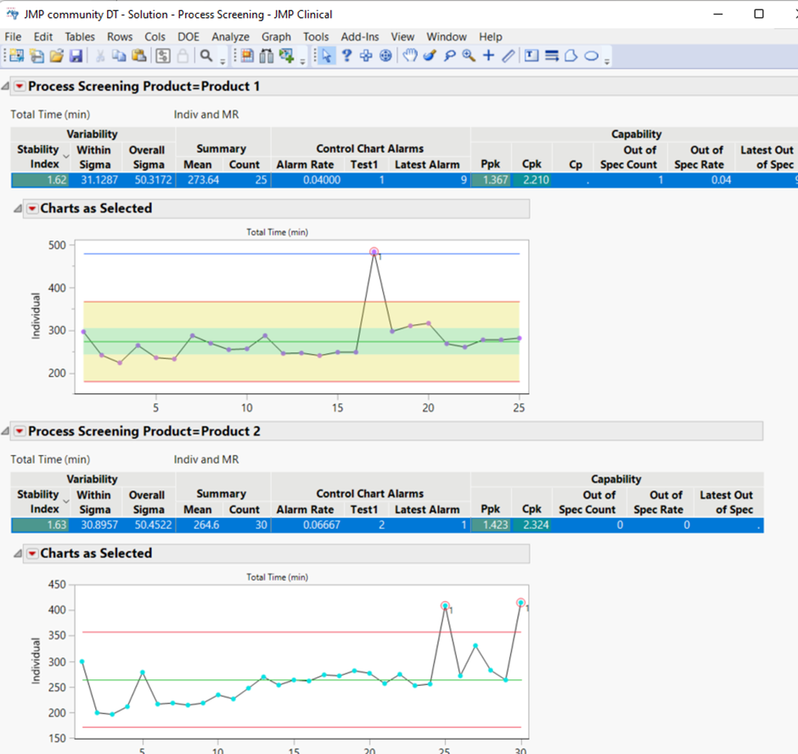
From here, the process screening platform will prompt you to select your process variable (Process) and Grouping (your ‘Product’ /the previous ‘by’ variable) and your LCL/UCL and USL/LSL spec limits. Press okay then it’s a simple case of activating ‘select chart as selected’ and highlighting your summary table.
Process Screening(
	SendToByGroup( Bygroup Default ),
	Process Variables( :"Total Time (min)"n ),
	Control Chart Type( "Indiv and MR" ),
	SendToByGroup( {:Product == "Product 1"}, Cp( 1 ) ),
	Show Charts as Selected( 1 ),
	SendToByGroup(
		{:Product == "Product 1"},
		Chart Options as Selected( Show Zones( 1 ), Show Spec Limits( 1 ) )
	),
	Use Limits Table(
		1,
		Data Table( "Spec Table" ),
		Process Variables( :Process ),
		Grouping( :Product ),
		LSL( :LSL ),
		USL( :USL ),
		Target( :Target ),
		Go
	),
	SendToByGroup( {:Product == "Product 1"}, RowStates( [0 1] ) ),
	SendToByGroup( {:Product == "Product 2"}, RowStates( [0 1] ) ),
	SendToByGroup( {:Product == "Product 3"}, RowStates( [0 1] ) ),
	By( :Product ),
	SendToByGroup(
		{:Product == "Product 1"},
		SendToReport(
			Dispatch(
				{"Process Screening Product=Product 1", "Charts as Selected"},
				"",
				ListBox,
				{Horizontal Alignment( "Right" )}
			),
			Dispatch(
				{"Process Screening Product=Product 1", "Charts as Selected"},
				"",
				TextBox,
				{Set Wrap( 520 ), Set Base Font( "Small" )}
			),
			Dispatch(
				{"Process Screening Product=Product 1", "Charts as Selected"},
				"",
				PictureBox,
				{Horizontal Alignment( "Right" )}
			),
			Dispatch(
				{"Process Screening Product=Product 1", "Charts as Selected"},
				"",
				TextEditBox,
				{Rotate Text( "Left" ), Set Wrap( 170 ),
				Set Base Font( "Axis Title" )}
			)
		)
	),
	SendToByGroup(
		{:Product == "Product 2"},
		SendToReport(
			Dispatch(
				{"Process Screening Product=Product 2"},
				"",
				TableBox,
				{set height( 69 ), set width( 830 )}
			),
			Dispatch(
				{"Process Screening Product=Product 2", "Charts as Selected"},
				"",
				ListBox,
				{Horizontal Alignment( "Right" )}
			),
			Dispatch(
				{"Process Screening Product=Product 2", "Charts as Selected"},
				"",
				TextBox,
				{Set Wrap( 520 ), Set Base Font( "Small" )}
			),
			Dispatch(
				{"Process Screening Product=Product 2", "Charts as Selected"},
				"",
				PictureBox,
				{Horizontal Alignment( "Right" )}
			),
			Dispatch(
				{"Process Screening Product=Product 2", "Charts as Selected"},
				"",
				TextEditBox,
				{Rotate Text( "Left" ), Set Wrap( 170 ),
				Set Base Font( "Axis Title" )}
			)
		)
	),
	SendToByGroup(
		{:Product == "Product 3"},
		SendToReport(
			Dispatch(
				{"Process Screening Product=Product 3", "Charts as Selected"},
				"",
				ListBox,
				{Horizontal Alignment( "Right" )}
			),
			Dispatch(
				{"Process Screening Product=Product 3", "Charts as Selected"},
				"",
				TextBox,
				{Set Wrap( 520 ), Set Base Font( "Small" )}
			),
			Dispatch(
				{"Process Screening Product=Product 3", "Charts as Selected"},
				"",
				PictureBox,
				{Horizontal Alignment( "Right" )}
			),
			Dispatch(
				{"Process Screening Product=Product 3", "Charts as Selected"},
				"",
				TextEditBox,
				{Rotate Text( "Left" ), Set Wrap( 170 ),
				Set Base Font( "Axis Title" )}
			)
		)
	)
)
I’ve attached the data table and the script for this process (saved by selecting ‘Save By Group Script’ in the red drop down menu). Let me know if this solution works for you!
Cheers,
Ben
Recommended Articles
- © 2026 JMP Statistical Discovery LLC. All Rights Reserved.
- Terms of Use
- Privacy Statement
- Contact Us


