- New to JMP? Let the Data Analysis Director guide you through selecting an analysis task, an analysis goal, and a data type. Available now in the JMP Marketplace!
- See how to install JMP Marketplace extensions to customize and enhance JMP.
- Subscribe to RSS Feed
- Mark Topic as New
- Mark Topic as Read
- Float this Topic for Current User
- Bookmark
- Subscribe
- Mute
- Printer Friendly Page
Discussions
Solve problems, and share tips and tricks with other JMP users.- JMP User Community
- :
- Discussions
- :
- Re: Charts are only partially showing up as interactive HTML
- Mark as New
- Bookmark
- Subscribe
- Mute
- Subscribe to RSS Feed
- Get Direct Link
- Report Inappropriate Content
Charts are only partially showing up as interactive HTML
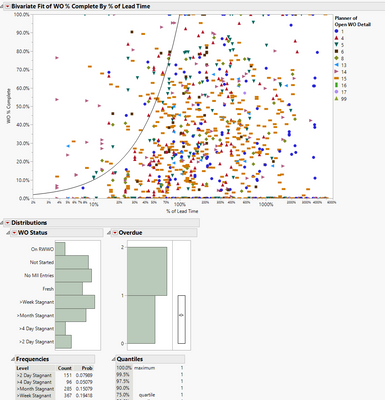
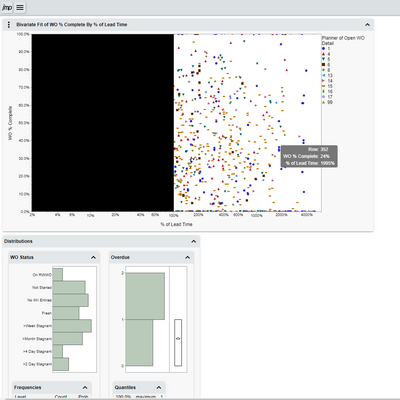
I have a set of charts that I want to save as an interactive HTML, but when the charts show up as a web page part of one of the charts is blacked out. Could this be due to the chart displaying too much data? I've tried with Chrome, Firefox, and Microsoft edge and they're all having the same problem.
Charts Displayed in JMP:
Charts displayed as Interactive HTML:
Accepted Solutions
- Mark as New
- Bookmark
- Subscribe
- Mute
- Subscribe to RSS Feed
- Get Direct Link
- Report Inappropriate Content
Re: Charts are only partially showing up as interactive HTML
Hi Brendon,
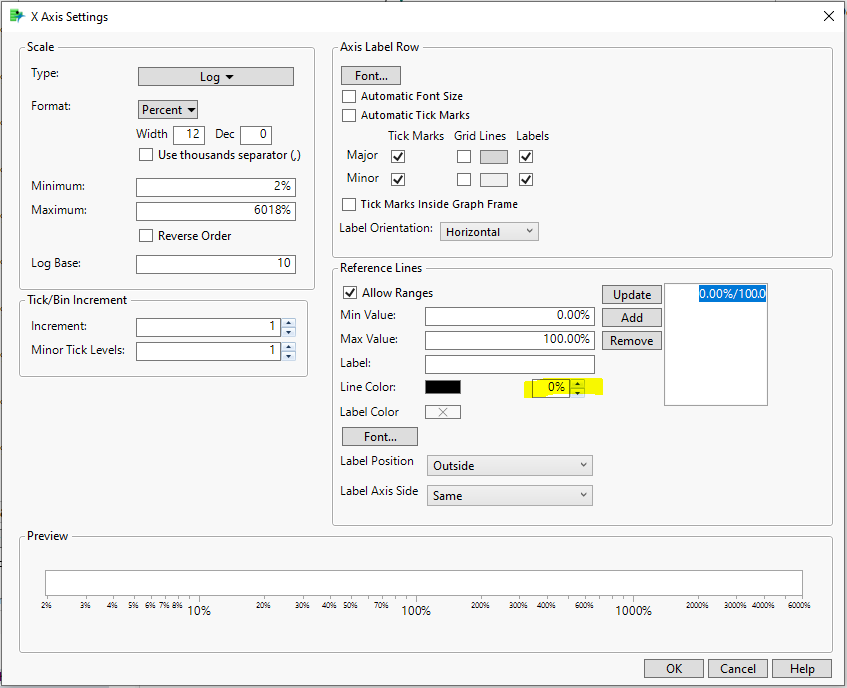
The blacked out area is a reference range on the X axis with an opacity of 0.
JMP treats this as completely transparent, but due to a bug in our Interactive HTML export, an opacity setting of exactly 0 is ignored causing the reference range to draw completely opaque.
I see a couple of options for anyone running into this issue until the bug is fixed.
1. Remove the reference area.
2. Use an opacity value of 0.0001.
In the script of the .jrp file you provided, the last parameter of the Add Ref Line function is the opacity set to 0.0001.
New Window( "Data Filter for Data Table",
	V List Box(
		Bivariate(
			Y( :WO % Complete ),
			X( :Name( "% of Lead Time" ) ),
			SendToReport(
				Dispatch(
					{},
					"1",
					ScaleBox,
					{Scale( "Log" ), Format( "Percent", 12, 0 ),
					Min( 0.0195073348627051 ), Max( 60.1773644765953 ), Inc( 1 ),
					Minor Ticks( 1 ), Add Ref Line(
						{0, 1},
						"Solid",
						"Black",
						"",
						1,
						0.0001
					)}
				),
I hope this helps.
~John
- Mark as New
- Bookmark
- Subscribe
- Mute
- Subscribe to RSS Feed
- Get Direct Link
- Report Inappropriate Content
Re: Charts are only partially showing up as interactive HTML
Hi,
It looks like the HTML version of the graph is backed out where the curve appears in the original version. Have you tried, as an experiment, generate the HTML version without the curve. If it shows properly, there might be something wrong with the background color of the curve. One possible way to resolve this would be to go to right-click on the graph (original), select Customize, and move the curve as far back as possible (just a thought).
Let us know if this works.
Best,
TS
- Mark as New
- Bookmark
- Subscribe
- Mute
- Subscribe to RSS Feed
- Get Direct Link
- Report Inappropriate Content
Re: Charts are only partially showing up as interactive HTML
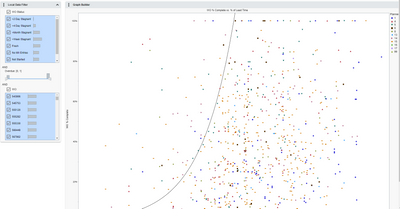
I went back and remade the graph and put all my distribution charts as local data filters and that seemed to do the trick.
- Mark as New
- Bookmark
- Subscribe
- Mute
- Subscribe to RSS Feed
- Get Direct Link
- Report Inappropriate Content
Re: Charts are only partially showing up as interactive HTML
Congratulations on the innovative work-around @bbass .
I'm curious as to what could have caused the area covered by the curve to be blacked out in your original graph. If you could reproduce it with data you can share here, I'd like to look into it. Otherwise, please feel free to send in a request to our technical support so we might be able to fix it for you and anyone else that tries to do the same thing.
Thanks,
~John
- Mark as New
- Bookmark
- Subscribe
- Mute
- Subscribe to RSS Feed
- Get Direct Link
- Report Inappropriate Content
Re: Charts are only partially showing up as interactive HTML
Hi John,
Attached is my original graph and a summarized data table that I used to create it. Let me know if you need anything else.
Thanks,
Brendon
- Mark as New
- Bookmark
- Subscribe
- Mute
- Subscribe to RSS Feed
- Get Direct Link
- Report Inappropriate Content
Re: Charts are only partially showing up as interactive HTML
Hi Brendon,
The blacked out area is a reference range on the X axis with an opacity of 0.
JMP treats this as completely transparent, but due to a bug in our Interactive HTML export, an opacity setting of exactly 0 is ignored causing the reference range to draw completely opaque.
I see a couple of options for anyone running into this issue until the bug is fixed.
1. Remove the reference area.
2. Use an opacity value of 0.0001.
In the script of the .jrp file you provided, the last parameter of the Add Ref Line function is the opacity set to 0.0001.
New Window( "Data Filter for Data Table",
	V List Box(
		Bivariate(
			Y( :WO % Complete ),
			X( :Name( "% of Lead Time" ) ),
			SendToReport(
				Dispatch(
					{},
					"1",
					ScaleBox,
					{Scale( "Log" ), Format( "Percent", 12, 0 ),
					Min( 0.0195073348627051 ), Max( 60.1773644765953 ), Inc( 1 ),
					Minor Ticks( 1 ), Add Ref Line(
						{0, 1},
						"Solid",
						"Black",
						"",
						1,
						0.0001
					)}
				),
I hope this helps.
~John
Recommended Articles
- © 2026 JMP Statistical Discovery LLC. All Rights Reserved.
- Terms of Use
- Privacy Statement
- Contact Us


