- New to JMP? Join us Sept. 23-24 for the Early User Edition of Discovery Summit, tailor-made for new users. Register now for free!
- Your voice matters! Tell us how you prefer to receive JMP updates, so we can tailor our communication to your needs. Take short survey.
- See how to access JMP Marketplace - and - find, create & share add-ins to extend your JMP. Watch video.
- Subscribe to RSS Feed
- Mark Topic as New
- Mark Topic as Read
- Float this Topic for Current User
- Bookmark
- Subscribe
- Mute
- Printer Friendly Page
Discussions
Solve problems, and share tips and tricks with other JMP users.- JMP User Community
- :
- Discussions
- :
- make all Bivariate plots into a column, rather than a row?

- Mark as New
- Bookmark
- Subscribe
- Mute
- Subscribe to RSS Feed
- Get Direct Link
- Report Inappropriate Content
make all Bivariate plots into a column, rather than a row?
I have a single Y value and many X values I'm plotting and the resulting output is 100's of charts in a single row, needing to scroll left/right.
I'm scripting it to plot the X values from a group of columns.
How can I get this to display in a column instead?
dtWIDE= current data table();

ERplot = Bivariate(
	Y( :ER_avg),
	X( dtWIDE<<get column group( "Step2" )),
	<<{Arrange in Rows( 52 ), Order by Goodness of Fit},
	//invisible, //use this to speed up.
);Accepted Solutions

- Mark as New
- Bookmark
- Subscribe
- Mute
- Subscribe to RSS Feed
- Get Direct Link
- Report Inappropriate Content
Re: make all Bivariate plots into a column, rather than a row?
Here is one way of handling it

Names Default To Here( 1 );
// Open Data Table: semiconductor capability.jmp
// → Data Table( "semiconductor capability" )
dtWide = Open( "$SAMPLE_DATA/semiconductor capability.jmp" );
ERplot = fit group(
	Oneway( Y( :NPN1 ), X( dtWIDE<<get column group( "Processes" ) ) ),
	<<{Arrange in Rows( 1 )}
);
- Mark as New
- Bookmark
- Subscribe
- Mute
- Subscribe to RSS Feed
- Get Direct Link
- Report Inappropriate Content
Re: make all Bivariate plots into a column, rather than a row?
Here is one way of handling it
Names Default To Here( 1 );
// Open Data Table: semiconductor capability.jmp
// → Data Table( "semiconductor capability" )
dtWide = Open( "$SAMPLE_DATA/semiconductor capability.jmp" );
ERplot = fit group(
	Oneway( Y( :NPN1 ), X( dtWIDE<<get column group( "Processes" ) ) ),
	<<{Arrange in Rows( 1 )}
);
- Mark as New
- Bookmark
- Subscribe
- Mute
- Subscribe to RSS Feed
- Get Direct Link
- Report Inappropriate Content
Re: make all Bivariate plots into a column, rather than a row?
Morning, Well this *works* kinda.
Yes, it changes the output to a single column of plots, but the problem is now that they are oneway plots instead of bivariate plots. I can't figure out how to add fit lines and model Rsquared on a oneway...

- Mark as New
- Bookmark
- Subscribe
- Mute
- Subscribe to RSS Feed
- Get Direct Link
- Report Inappropriate Content
Re: make all Bivariate plots into a column, rather than a row?
Hi I'm not sure it's that can help you to sovle your problem.
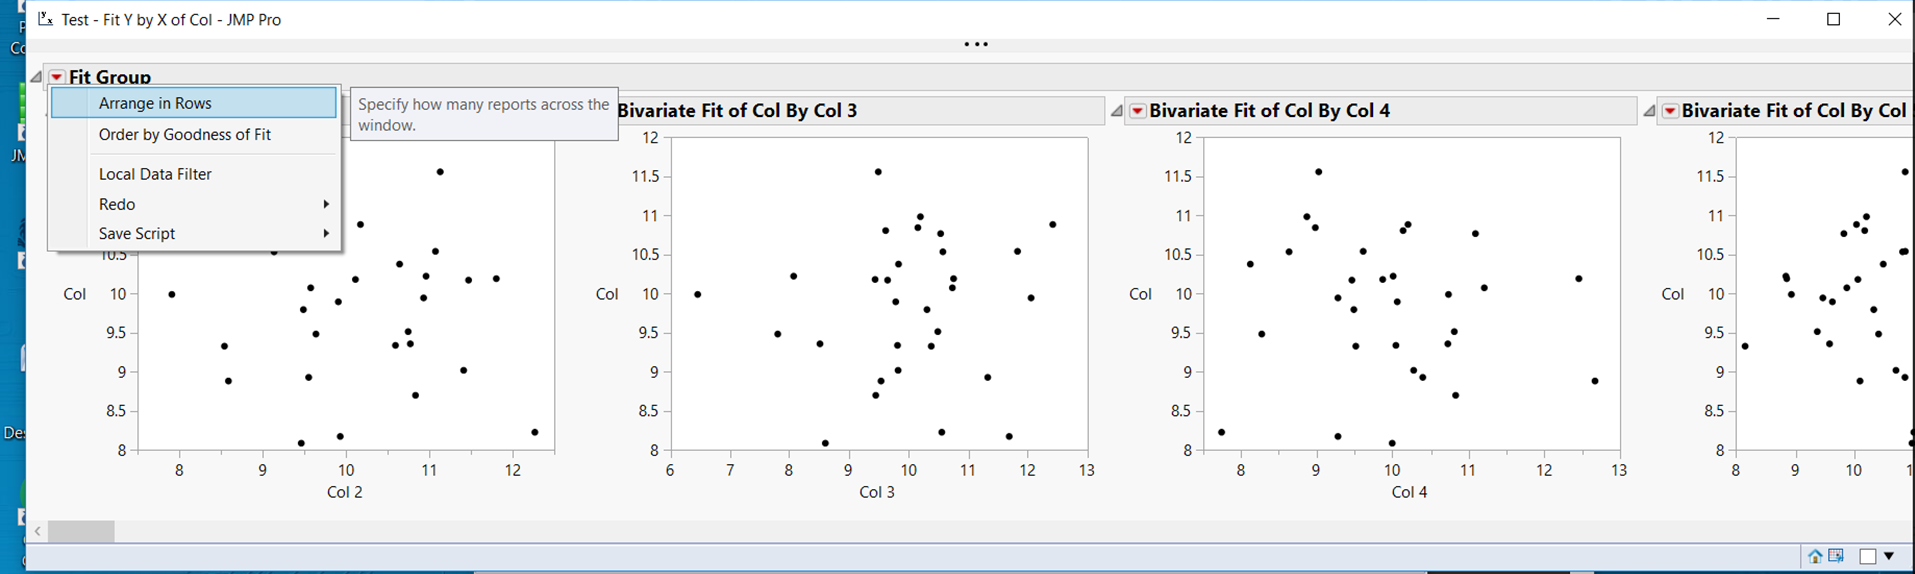
I guess you want to change the window UI from one raw to a matrix.
If it correct, you can set parameter <<{Arrange in Rows( 3 )} in JSL or select option in red triangle and change the format from a row to a matrix.
Names Default To Here( 1 );
dt = New Table( "Test" );
For( i = 1, i <= 100, i++,
	dt << New Column( "Col", Continuous, formula( Random Normal( 10, 1 ) ) )
);
dt << add rows( 30 );
dt<<Fit Group(
	Bivariate( Y( :Col ), X( :Col 2 ) ),
	Bivariate( Y( :Col ), X( :Col 3 ) ),
	Bivariate( Y( :Col ), X( :Col 4 ) ),
	Bivariate( Y( :Col ), X( :Col 5 ) ),
	Bivariate( Y( :Col ), X( :Col 6 ) ),
	Bivariate( Y( :Col ), X( :Col 7 ) ),
	Bivariate( Y( :Col ), X( :Col 8 ) ),
	Bivariate( Y( :Col ), X( :Col 9 ) ),
	Bivariate( Y( :Col ), X( :Col 10 ) ),
	Bivariate( Y( :Col ), X( :Col 11 ) ),
	Bivariate( Y( :Col ), X( :Col 12 ) ),
	Bivariate( Y( :Col ), X( :Col 13 ) ),
	Bivariate( Y( :Col ), X( :Col 14 ) ),
	Bivariate( Y( :Col ), X( :Col 15 ) ),
	Bivariate( Y( :Col ), X( :Col 16 ) ),
	Bivariate( Y( :Col ), X( :Col 17 ) ),
	Bivariate( Y( :Col ), X( :Col 18 ) ),
	Bivariate( Y( :Col ), X( :Col 19 ) ),
	Bivariate( Y( :Col ), X( :Col 20 ) ),
	Bivariate( Y( :Col ), X( :Col 21 ) ),
	Bivariate( Y( :Col ), X( :Col 22 ) ),
	Bivariate( Y( :Col ), X( :Col 23 ) ),
	Bivariate( Y( :Col ), X( :Col 24 ) ),
	Bivariate( Y( :Col ), X( :Col 25 ) ),
	Bivariate( Y( :Col ), X( :Col 26 ) ),
	Bivariate( Y( :Col ), X( :Col 27 ) ),
	Bivariate( Y( :Col ), X( :Col 28 ) ),
	Bivariate( Y( :Col ), X( :Col 29 ) ),
	Bivariate( Y( :Col ), X( :Col 30 ) ),
	Bivariate( Y( :Col ), X( :Col 31 ) ),
	Bivariate( Y( :Col ), X( :Col 32 ) ),
	Bivariate( Y( :Col ), X( :Col 33 ) ),
	Bivariate( Y( :Col ), X( :Col 34 ) ),
	Bivariate( Y( :Col ), X( :Col 35 ) ),
	Bivariate( Y( :Col ), X( :Col 36 ) ),
	Bivariate( Y( :Col ), X( :Col 37 ) ),
	Bivariate( Y( :Col ), X( :Col 38 ) ),
	Bivariate( Y( :Col ), X( :Col 39 ) ),
	Bivariate( Y( :Col ), X( :Col 40 ) ),
	Bivariate( Y( :Col ), X( :Col 41 ) ),
	Bivariate( Y( :Col ), X( :Col 42 ) ),
	Bivariate( Y( :Col ), X( :Col 43 ) ),
	Bivariate( Y( :Col ), X( :Col 44 ) ),
	Bivariate( Y( :Col ), X( :Col 45 ) ),
	Bivariate( Y( :Col ), X( :Col 46 ) ),
	Bivariate( Y( :Col ), X( :Col 47 ) ),
	Bivariate( Y( :Col ), X( :Col 48 ) ),
	Bivariate( Y( :Col ), X( :Col 49 ) ),
	Bivariate( Y( :Col ), X( :Col 50 ) ),
	Bivariate( Y( :Col ), X( :Col 51 ) ),
	Bivariate( Y( :Col ), X( :Col 52 ) ),
	Bivariate( Y( :Col ), X( :Col 53 ) ),
	Bivariate( Y( :Col ), X( :Col 54 ) ),
	Bivariate( Y( :Col ), X( :Col 55 ) ),
	Bivariate( Y( :Col ), X( :Col 56 ) ),
	Bivariate( Y( :Col ), X( :Col 57 ) ),
	Bivariate( Y( :Col ), X( :Col 58 ) ),
	Bivariate( Y( :Col ), X( :Col 59 ) ),
	Bivariate( Y( :Col ), X( :Col 60 ) ),
	Bivariate( Y( :Col ), X( :Col 61 ) ),
	Bivariate( Y( :Col ), X( :Col 62 ) ),
	Bivariate( Y( :Col ), X( :Col 63 ) ),
	Bivariate( Y( :Col ), X( :Col 64 ) ),
	Bivariate( Y( :Col ), X( :Col 65 ) ),
	Bivariate( Y( :Col ), X( :Col 66 ) ),
	Bivariate( Y( :Col ), X( :Col 67 ) ),
	Bivariate( Y( :Col ), X( :Col 68 ) ),
	Bivariate( Y( :Col ), X( :Col 69 ) ),
	Bivariate( Y( :Col ), X( :Col 70 ) ),
	Bivariate( Y( :Col ), X( :Col 71 ) ),
	Bivariate( Y( :Col ), X( :Col 72 ) ),
	Bivariate( Y( :Col ), X( :Col 73 ) ),
	Bivariate( Y( :Col ), X( :Col 74 ) ),
	Bivariate( Y( :Col ), X( :Col 75 ) ),
	Bivariate( Y( :Col ), X( :Col 76 ) ),
	Bivariate( Y( :Col ), X( :Col 77 ) ),
	Bivariate( Y( :Col ), X( :Col 78 ) ),
	Bivariate( Y( :Col ), X( :Col 79 ) ),
	Bivariate( Y( :Col ), X( :Col 80 ) ),
	Bivariate( Y( :Col ), X( :Col 81 ) ),
	Bivariate( Y( :Col ), X( :Col 82 ) ),
	Bivariate( Y( :Col ), X( :Col 83 ) ),
	Bivariate( Y( :Col ), X( :Col 84 ) ),
	Bivariate( Y( :Col ), X( :Col 85 ) ),
	Bivariate( Y( :Col ), X( :Col 86 ) ),
	Bivariate( Y( :Col ), X( :Col 87 ) ),
	Bivariate( Y( :Col ), X( :Col 88 ) ),
	Bivariate( Y( :Col ), X( :Col 89 ) ),
	Bivariate( Y( :Col ), X( :Col 90 ) ),
	Bivariate( Y( :Col ), X( :Col 91 ) ),
	Bivariate( Y( :Col ), X( :Col 92 ) ),
	Bivariate( Y( :Col ), X( :Col 93 ) ),
	Bivariate( Y( :Col ), X( :Col 94 ) ),
	Bivariate( Y( :Col ), X( :Col 95 ) ),
	Bivariate( Y( :Col ), X( :Col 96 ) ),
	Bivariate( Y( :Col ), X( :Col 97 ) ),
	Bivariate( Y( :Col ), X( :Col 98 ) ),
	Bivariate( Y( :Col ), X( :Col 99 ) ),
	Bivariate( Y( :Col ), X( :Col 100 ) ),
	<<{Arrange in Rows( 3 )}
);- Mark as New
- Bookmark
- Subscribe
- Mute
- Subscribe to RSS Feed
- Get Direct Link
- Report Inappropriate Content
Re: make all Bivariate plots into a column, rather than a row?
how to make this dynamic? I want to plot my output value Y (Etchrate) against a long group of input columns X (grouped cols) and display in a vertical window of graphs instead of a huge scroll left-right window.
- Mark as New
- Bookmark
- Subscribe
- Mute
- Subscribe to RSS Feed
- Get Direct Link
- Report Inappropriate Content
Re: make all Bivariate plots into a column, rather than a row?
- Which person are you replying to? The code I provided in my last response
Names Default To Here( 1 );
// Open Data Table: semiconductor capability.jmp
// → Data Table( "semiconductor capability" )
dtWide = Open( "$SAMPLE_DATA/semiconductor capability.jmp" );
ERplot = fit group(
	bivariate( Y( :NPN1 ), X( dtWIDE<<get column group( "Processes" ) ) ),
	<<{Arrange in Rows( 1 )}
);
provides a vertical list of graphs, using a single x column and a variable grouping for the Y columns.
- There is also another platform that you may want to look at, Response Screening. If you put in your X variable and Y grouping, it will generate a data table with all of the results listed in significance order. You can then select from the list, and it will display the selected graphs in a vertical list.

Recommended Articles
- © 2026 JMP Statistical Discovery LLC. All Rights Reserved.
- Terms of Use
- Privacy Statement
- Contact Us