- Don’t miss your chance to experience Discovery Summit Europe at our best available rate! Early bird registration through 31 Oct.
- Graph Builder Toolbar streamlines interactive graphing. Creates shortcuts on Report and GraphBuilder Helpers toolbars. Download and install the extension.
- JMP will suspend normal business operations for our Rest and Recharge Day on Friday, October 2, 2026.
Regular business hours will resume on Monday, October 5, 2026.
- Subscribe to RSS Feed
- Mark Topic as New
- Mark Topic as Read
- Float this Topic for Current User
- Bookmark
- Subscribe
- Mute
- Printer Friendly Page
Discussions
Solve problems, and share tips and tricks with other JMP users.- User Community
- :
- Discussions
- :
- Changing data types and modelling type while plotting data

- Mark as New
- Bookmark
- Subscribe
- Mute
- Subscribe to RSS Feed
- Get Direct Link
- Report Inappropriate Content
Changing data types and modelling type while plotting data
Hi Team,
It's kind of I'm stuck, I want to change the data type of a column when plotting.
Explanation : My original data type is "numeric and continuous" but I want to change the data type to "character and nominal" via JSL. It is needed because visual analysis of plots are not very impressive as we can see here
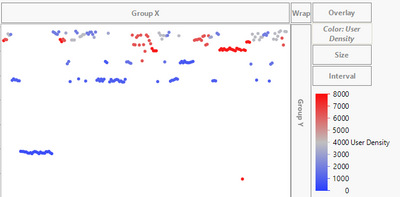
And with data types changed it's acceptable
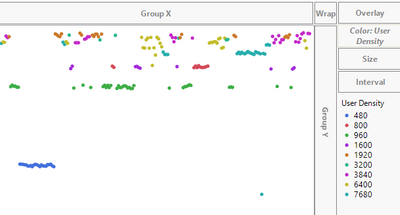
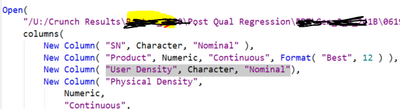
1) I'm using JSL for plotting using Graph builder, by any chance can I change here in below line beside "user density" while plotting?
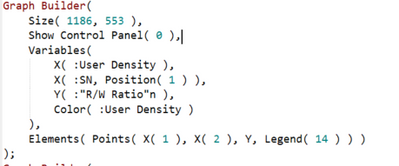
To explain more here, though I'm changing the data and modelling types but it seems JMP is not processing the below line arrow marked
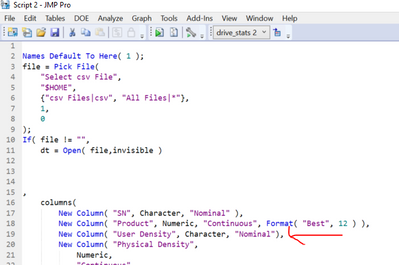
Whereas when I'm using this open function code is working as desired and JMP is reading the user density data type and while plotting it's giving desired results.
Accepted Solutions


- Mark as New
- Bookmark
- Subscribe
- Mute
- Subscribe to RSS Feed
- Get Direct Link
- Report Inappropriate Content
Re: Changing data types and modelling type while plotting data
You can change the data type of column by sending message << Data Type()

and for modeling type use << Set Modeling Type()
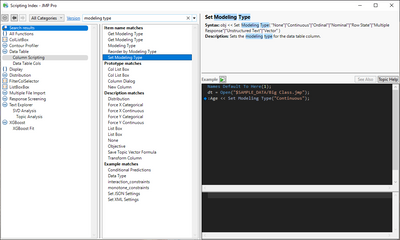
Perform these actions after you have the data table open
- Mark as New
- Bookmark
- Subscribe
- Mute
- Subscribe to RSS Feed
- Get Direct Link
- Report Inappropriate Content
Re: Changing data types and modelling type while plotting data
You can change the data type of column by sending message << Data Type()
and for modeling type use << Set Modeling Type()
Perform these actions after you have the data table open
Recommended Articles
- © 2026 JMP Statistical Discovery LLC. All Rights Reserved.
- Terms of Use
- Privacy Statement
- Contact Us