- Learn how to build custom Python data connectors and further customize JMP’s Data Connector Framework with the Python Data Connector Demo, available now in the JMP Marketplace!
- See how to use Accelerated Life Testing (ALT) to evaluate reliability. Register for June 5 webinar, 2pm US Eastern Time.
- Subscribe to RSS Feed
- Mark Topic as New
- Mark Topic as Read
- Float this Topic for Current User
- Bookmark
- Subscribe
- Mute
- Printer Friendly Page
Discussions
Solve problems, and share tips and tricks with other JMP users.- JMP User Community
- :
- Discussions
- :
- Calculation of t-distribution, JMP 13

- Mark as New
- Bookmark
- Subscribe
- Mute
- Subscribe to RSS Feed
- Get Direct Link
- Report Inappropriate Content
Calculation of t-distribution, JMP 13
Hello,
I would like to knwo, how the t-distribution is calculated in the programm. The results I got from the programs are different with the results I calculated by myself, with the help of methods, mentioned in various books and scientific researches.
In addition I would like to know, how it is possible to set up an own quantil in the t-distribution. When I make a box plot, I just can change it in the standard normal distribution.
My calculation way is
n = 4
calculate mean and variance
calculate c = value from table http://www.sjsu.edu/faculty/gerstman/StatPrimer/t-table.pdf for a 95% each side
df = n-1
(c*root(variance))/(root(n))=k
mean+-k = result
Thanks for you ideas,

- Mark as New
- Bookmark
- Subscribe
- Mute
- Subscribe to RSS Feed
- Get Direct Link
- Report Inappropriate Content
Re: Calculation of t-distribution, JMP 13
Thank you for posting the pictures.
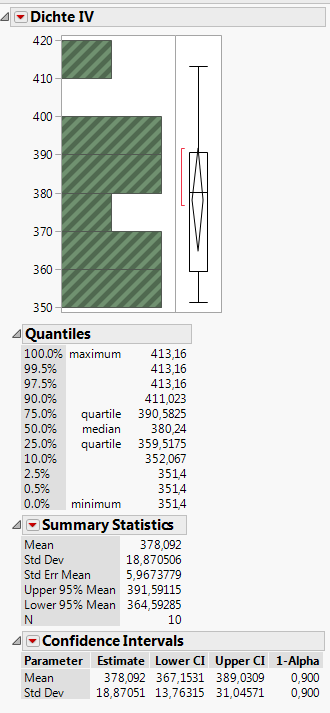
Your computation is for a two-sided confidence interval with 95% confidence. That is exactly what JMP is reporting in the Summary Statistics in the Distribution platform (fourth picture).
You want 95% confidence between both tails of the distribution so you center the 95% of the t distribution leaving 2.5% on either side. We still label it as Lower 95% Mean and Upper 95% Mean to indication the confidence level. It is a short label meant to convey the lower or upper bound on the location of the population mean with 95% confidence. This kind of labeling is common.
If you actually want 5% in both tails, then you want a two-sided 90% confidence interval. Click the red triangle at the top of the Distribution platform next to the name of your variable and select Confidence Interval > 0.90 and you will get the desired interval.
The numbers from your manual calculation and from JMP might not agree exactly because you are using a t quantile rounded to three decimal places and JMP is using the full precision value, but the values should be close to three or four significant digits.
- Mark as New
- Bookmark
- Subscribe
- Mute
- Subscribe to RSS Feed
- Get Direct Link
- Report Inappropriate Content
Re: Calculation of t-distribution, JMP 13
But one more question. Is the a possibility to set the value for the upper and lower mean to 0,90 for all "Summary Statistic" or do I have it to change for every boxplot seperately? The automatic given value is always 0,95. Even when i close and open the boxplot again.
So far I have 7 Datasheets with 4 boxplots for each.
- Mark as New
- Bookmark
- Subscribe
- Mute
- Subscribe to RSS Feed
- Get Direct Link
- Report Inappropriate Content
Re: Calculation of t-distribution, JMP 13
There are a couple of ways that might work for you.
- If you use the way I showed (apply a data filter and select each group in turn), then click the red triangle next to Summary Statistics and change the confidence level at the bottom.
- If you always want 90% intervals from Distribution, then change your preference: select File > Preferences > Platforms, then select Distribution in the list and you will find Confidence Interval in the second column of settings.
I hope that one of these approaches is satisfactory. The second approach might be the best because it will be a global change to JMP behavior.
- Mark as New
- Bookmark
- Subscribe
- Mute
- Subscribe to RSS Feed
- Get Direct Link
- Report Inappropriate Content
Re: Calculation of t-distribution, JMP 13
The first way doesnt work for me. I still have the 95% mean everywhere.
The second way doesnt change the 95% mean too. I just get an additional chart, but now I have to adjust to my prefered values manually every time. So all in all it is not less work.
- Mark as New
- Bookmark
- Subscribe
- Mute
- Subscribe to RSS Feed
- Get Direct Link
- Report Inappropriate Content
Re: Calculation of t-distribution, JMP 13
Using the local data filter approach should not give you more than one set of results so I don't understand what you mean by everywhere. This way gives you a focus of a single Summary Statistics outline that updates when you change the level in the filter from one group to another.
I believe that what you mean by 'chart' is not a plot or graphic but another outline for Confidence Intervals. If so, then you should get 90% in any NEW analyses after the change to your preferences. It does not update previous analyses.
- Mark as New
- Bookmark
- Subscribe
- Mute
- Subscribe to RSS Feed
- Get Direct Link
- Report Inappropriate Content
Re: Calculation of t-distribution, JMP 13
And there is a new problem. I just tried to add some menues, some of them you can delete, but others seems like to stay there forever. See picture below.
Only way to get rid of the menu "Test Standard Deviation" was to delete the whole boxplot of "Dichte IV". Unfortunately it was part of a group with boxplots. I am missing a shortcut like "Strg"+"Z", with whom I can make changes unhappen. So now my only way is to delte everything and do it again. Any solution to avoid this?
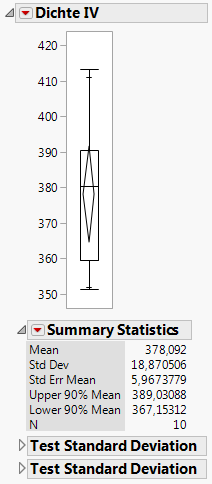
- Mark as New
- Bookmark
- Subscribe
- Mute
- Subscribe to RSS Feed
- Get Direct Link
- Report Inappropriate Content
Re: Calculation of t-distribution, JMP 13
Let's call the area with the results an outline. Menus appear in the menu bar at the top or when you click a red triangle.
No, you cannot delete the Test Standard Deviation outline. Generally, you state the alternative hypothesis before the experiment and then test it here once. If you keep testing different alternative hypotheses, then you are "fishing" for a significant difference. JMP will let you test as many alternatives as you like, but you are now increasing the experiment-wise level of risk of a type I error.
- « Previous
- Next »
Recommended Articles
- © 2026 JMP Statistical Discovery LLC. All Rights Reserved.
- Terms of Use
- Privacy Statement
- Contact Us