- JMP Statement Regarding Critical PHP Remote Code Execution Vulnerabilities (CVE-2026-109618, CVE-2026-109619)
- Don’t miss your chance to experience Discovery Summit Europe at our best available rate! Early bird registration through 31 Oct.
- Graph Builder Toolbar streamlines interactive graphing. Creates shortcuts on Report and GraphBuilder Helpers toolbars. Download and install the extension.
- Subscribe to RSS Feed
- Mark Topic as New
- Mark Topic as Read
- Float this Topic for Current User
- Bookmark
- Subscribe
- Mute
- Printer Friendly Page
Discussions
Solve problems, and share tips and tricks with other JMP users.- User Community
- :
- Discussions
- :
- Better way to plot multiple FitY by X plots

- Mark as New
- Bookmark
- Subscribe
- Mute
- Subscribe to RSS Feed
- Get Direct Link
- Report Inappropriate Content
Better way to plot multiple FitY by X plots
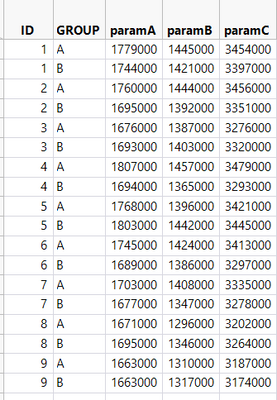
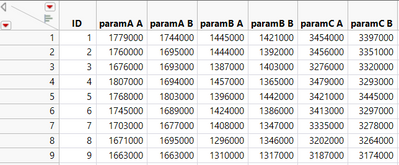
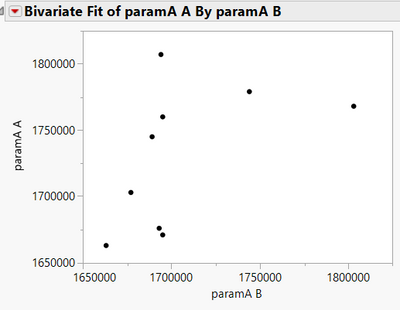
My original source table is the tall table with ID, group and tons of params. I want to plot all params Fit Y by X (Group A vs Group B group by ID). The traditional way i do is i change the tall table to wide table and plot one params at a time. But if i have hundreds of params, it is not a good solution. Is there any better or smarter way to do this ?
attached sample jmp files
tall table
switch to wide table
Plot paramA A vs ParamA B
Accepted Solutions


- Mark as New
- Bookmark
- Subscribe
- Mute
- Subscribe to RSS Feed
- Get Direct Link
- Report Inappropriate Content
Re: Better way to plot multiple FitY by X plots
Taking your example data, I first split the data into your Wide form, and then I took that data table and did a multi series stack
Tables=>Stack
specifying a 2 column stack
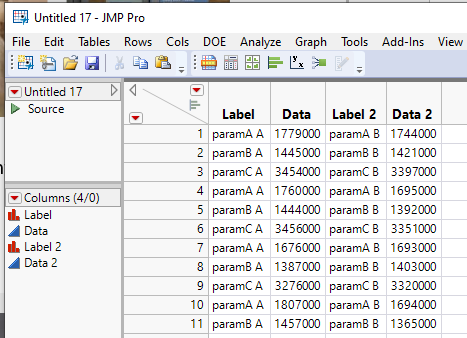
I then added a simple new column called Analysis which is a simple concatenation of the Label and Label 2 columns
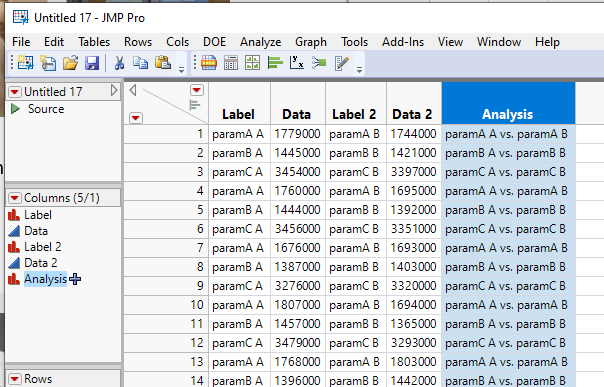
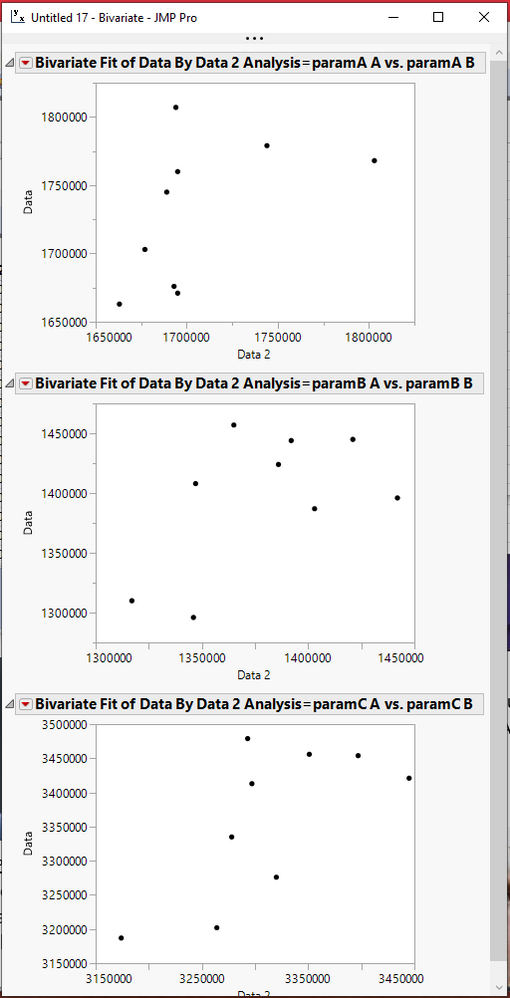
Finally, I ran the Fit Y by X specifying Data and Data 2 as the Y and X columns and then setting the Analysis column as the By column, giving the results below
- Mark as New
- Bookmark
- Subscribe
- Mute
- Subscribe to RSS Feed
- Get Direct Link
- Report Inappropriate Content
Re: Better way to plot multiple FitY by X plots
Taking your example data, I first split the data into your Wide form, and then I took that data table and did a multi series stack
Tables=>Stack
specifying a 2 column stack
I then added a simple new column called Analysis which is a simple concatenation of the Label and Label 2 columns
Finally, I ran the Fit Y by X specifying Data and Data 2 as the Y and X columns and then setting the Analysis column as the By column, giving the results below
- Mark as New
- Bookmark
- Subscribe
- Mute
- Subscribe to RSS Feed
- Get Direct Link
- Report Inappropriate Content
Re: Better way to plot multiple FitY by X plots
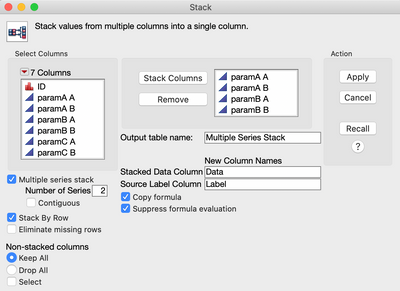
How you do the 1st step - specifying a 2 column stack? Can you further elaborate?

- Mark as New
- Bookmark
- Subscribe
- Mute
- Subscribe to RSS Feed
- Get Direct Link
- Report Inappropriate Content
Re: Better way to plot multiple FitY by X plots


- Mark as New
- Bookmark
- Subscribe
- Mute
- Subscribe to RSS Feed
- Get Direct Link
- Report Inappropriate Content
Re: Better way to plot multiple FitY by X plots
Same concept as @txnelson but I would arrange the table just a little differently by stacking to make a very long table, then splitting by the group column. Finally use the parameter in the by column of a bivariate script:
names default to here(1);

Long = Data Table( "DEBUG" ) << Stack(
	columns( :paramA, :paramB, :paramC ),
	Source Label Column( "Parameter" ),
	Stacked Data Column( "Data" )
);

repivot = Long << Split(
	Split By( :GROUP ),
	Split( :Data ),
	Group( :Parameter, :ID ),
	Sort by Column Property
);

biv = Bivariate( Y( :A ), X( :B ), Summary Statistics( 1 ), By( :Parameter ) );

dtSum = (biv << XPath("//TableBox"))[1][1] << make combined data table;

dtSum << Select Where(:Column 1 != "Correlation");
dtSum << Delete Rows;
dtSum << Set Name( "Results" );
Then the resulting table can be sorted to find the interesting correlations.
The response screening platform certainly seems promising though.
- Mark as New
- Bookmark
- Subscribe
- Mute
- Subscribe to RSS Feed
- Get Direct Link
- Report Inappropriate Content
Re: Better way to plot multiple FitY by X plots
Another platform that you might explore is response screening. I find it a helpful tool for looking at many fit y by x's. See response screening documentation .
Recommended Articles
- © 2026 JMP Statistical Discovery LLC. All Rights Reserved.
- Terms of Use
- Privacy Statement
- Contact Us