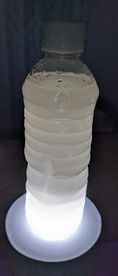
In Part 1 of this blog series, we will conduct a screening experiment that considers four factors regarding the brightness of PET bottle lanterns: liquid type, volume, concentration (converted to common logarithm), and the shape of the PET bottle (folds, cola). was carried out.

Experiments confirmed that the volume, concentration, and shape of the plastic bottle affected brightness. Therefore, in Part 2, based on the results of the screening experiment, we will consider practicality in times of disaster. By applying a response surface model, we will investigate the optimal capacity and concentration when using a sports drink in a folded PET bottle as a lantern.
Reference: Previous blog
Using Design of Experiments (DOE) to find out the conditions that make a plastic bottle lantern the brightest ~ Part 1. Screening experiment ~
Optimization experiment
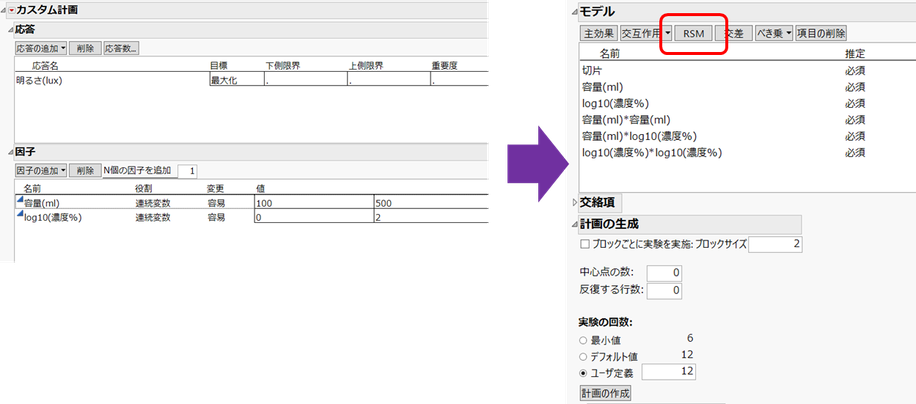
Let's create a plan to fit a response surface model using "Custom Design". Set the response and factors as below, and in the "model" [RSM] (for Response Surface Model) button to specify a response surface model (a model that includes main effects, quadratic interactions, and squared terms). The default value for the number of experiments is 12, and the design will be created by clicking the [Create Design] button.

■Input of experimental data, visualization of experimental data
I conducted an experiment on the created plan and entered the brightness (lux) read from the illumination meter.
At the same time, we created a graph showing the relationship between experimental points and brightness in the experimental area using Graph Builder. In this experiment
The experimental points are the apex of the experimental area, the axis point (the level between the lower limit and upper limit of each factor), and the center point. Such a plan central complex plan This is a typical plan for fitting a response surface.

In the experimental area, the upper right (both capacity and concentration are larger) seems to be brighter.
■Analysis report
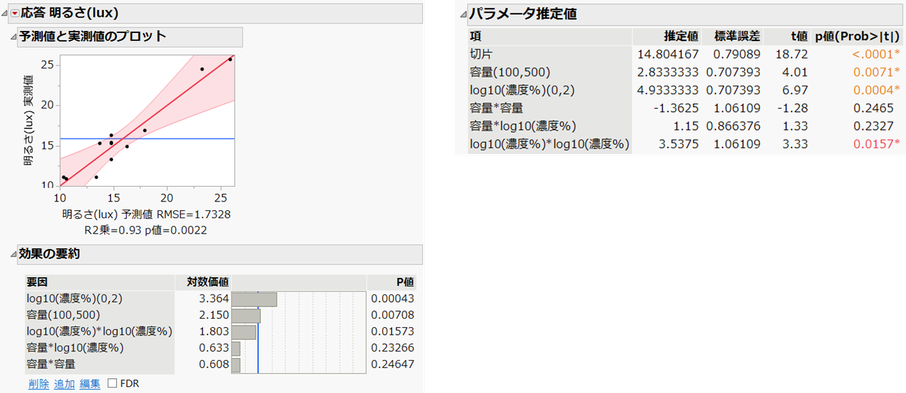
This is an analysis report when fitting a response surface model.
- Looking at the "Predicted Values and Actual Values Report", R squared is 0.93, It can be seen that there are no experimental points that deviate significantly from the red line (the area where measured values and predicted values match). For a model that uses two factors, the model has a good fit.
- Looking at the "Parameter estimate" report, the squared term of log10 (concentration) is significant, that is, there is a surface effect.

■Prediction profile
In the prediction profile, the conditions for the factor that gives the largest predicted brightness value are [Maximize satisfaction] I tried using options.

When putting a sports drink in a Hida Hida bottle, the brightness is at its maximum when the volume is 500ml and the concentration is 100%, and the brightness at that time is 25.9 (lux).
From this, we learned that if you want to use a sports drink as a plastic bottle lantern, you can simply use the unopened bottle without adjusting the volume or concentration.
■Contour profile
Let's visualize the fitted response surface model using contour lines. The "contour profile" below is a contour line when the horizontal axis is capacity and the vertical axis is log10 (concentration). Furthermore, areas where the predicted brightness value is 20 or higher are shown in white.

If it is sufficient that the brightness is 20 (lux) or more, it would be a good idea to consider setting the factor within the white area.
Even if you drink about half of a sports drink (capacity is 250ml), the brightness is predicted to be over 20 (lux), so it is thought that sufficient brightness will be obtained.
Confirmation experiment
Finally, we performed the experiment again under conditions that we would like to set the factors in the future, such as optimal conditions, and confirmed that the measured values and the predicted values obtained by the model were close to each other.
In this example, the brightness reached its maximum when the volume was 500ml and the concentration was 100%, so we measured the brightness again under these conditions, separate from the previous experiments, and found that Measured value is 25.5(lux) have become.
Under the optimal conditions determined by the prediction profile Predicted value is 25.9(lux) Therefore, the measured value and predicted value are close, confirming the reproducibility of brightness under optimal conditions.
I've been experimenting as an amateur...
I introduced the plastic bottle lantern experiment in two parts, but the experiment was surprisingly difficult. I had to adjust the concentration and volume, so I did it in my kitchen at home. I was adjusting concentrations and entering experimental data in the dim light using measuring cups, and before I knew it, it was midnight. . .
Despite this, we managed to obtain enough experimental results to explain to everyone. However, since I conducted an experiment at the level of independent science research, I have doubts about whether the results are really accurate, and whether they are reproducible or generalizable. If you are interested, please try experimenting.
Plastic bottle lanterns are one way to provide adequate brightness in emergencies. Please keep this in mind.
by Naohiro Masukawa (JMP Japan)
Naohiro Masukawa - JMP User Community
You must be a registered user to add a comment. If you've already registered, sign in. Otherwise, register and sign in.