cancel
Showing results for 
Show  only  | Search instead for 
Did you mean: 
The Discovery Summit 2025 Call for Content is open! Submit an abstract today to present at our premier analytics conference.
Get the free JMP Student Edition for qualified students and instructors at degree granting institutions.
Choose Language Hide Translation Bar
View Original Published Thread

Using Design of Experiments (DOE) to find out the conditions that make a plastic bottle lantern the brightest - Part 1. Screening experiment ~

Did you know that you can make a simple lantern by simply placing a plastic bottle filled with liquid on top of a flashlight? For example, when a power outage occurs due to a disaster, flashlights alone may not provide enough light. At that time, by placing a plastic bottle filled with water or the like on top of a flashlight, the light will diffusely reflect and become brighter, illuminating the surrounding area.


undefined


During a power outage, it is desirable to be able to brighten up the surrounding area as much as possible, but the amount of brightness seems to vary depending on the various conditions of the PET bottle. So let's do an experiment.


However, this does not mean blindly experimenting. Let's conduct experiments and draw conclusions based on experimental design.


Brightness experiment with “plastic bottle lantern”

Create a base with a flashlight embedded in it and set up a light meter about 50cm away.

Place a plastic bottle filled with liquid on the base, and after a while, read the value (lux) on the illumination meter once it stabilizes.


We have prepared a video of the experiment.

Petlanthanum.mp4
Video Player is loading.
Current Time 0:00
Duration 0:24
Loaded: 0%
Stream Type LIVE
Remaining Time 0:24
 
1x
    • Chapters
    • descriptions off, selected
    • captions off, selected
    • en (Main), selected


    The response is "brightness (lux)", and the purpose is to make it the largest (maximize).

    • The four factors are the type of liquid in the plastic bottle, the volume, the concentration (converted to a common logarithm), and the shape of the plastic bottle.
    • Water can be used as the type of liquid, but this time we decided to consider three types: sports drinks, lactic acid bacteria drinks, and milk.

    List of factors

    undefined


    undefinedundefined

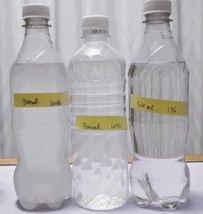
    Left figure: Types of PET bottles (Cola, Hida Hida), Right figure: Differences in concentration (100%, 10%, 1%)


    Flow of experimental design in this experiment

    First, we conduct a screening experiment to extract important factors from the four factors. Once an important factor is found, we use that factor to perform another experiment to fit the response surface, and then fit the model to find the factor conditions that will give the brightest light (optimization).


    Step 1: Screening for important factors

    undefined


    Step 2: Create and optimize response surface

    undefined


    screening experiment

    In this screening experiment, we will screen the main effect and the quadratic interaction of the three factors "liquid type," "volume," and "log10 (concentration)." (The interaction effect on "bottle shape" is not considered.)

    ■Creating an experimental plan using a custom design

    JMP's [Custom Plan] Use this to create a screening plan.

    In the Model, include a main effect and three two-way interactions (Liquid type*Volume, Liquid type*log10(concentration), and Volume*log10(concentration)). At this time, the default value for the number of experiments is 18, so here we will create a plan with this number of experiments.


    undefined


    Perform the experiment based on the generated 18 experiment plan and enter the response (brightness).


    ■Visualization of experimental data

    Before fitting the model, let's visualize the experimental data obtained. Using Graph Builder, you can visualize things like:


    undefined


    Left figure: Line graph with experiment order on the X-axis and response on the Y-axis. Check to see if the experiment order is affecting the results.

    Right figure: Check factorial effect diagrams, scatter plots with factors on the X axis and responses on the Y axis, line graphs (connecting the averages of each level), the relationship between responses and factors, the presence of outliers, etc.


    ■Analysis report

    When you run the "Model" script at the top left of the data table, the model specified in the custom design will be applied.


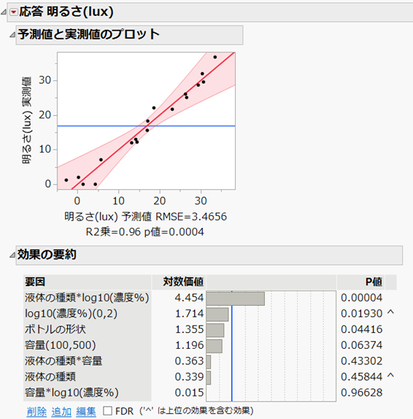
    • Referring to the "Plot of predicted values and measured values", there are no experimental points that deviate significantly from the red line (region where the measured values and predicted values match), and the R square shows a high value of 0.96, so a good fit is achieved. You can see that there are.
    • Referring to the "Effect Summary" report, the following are significant at the 5% significance level: "Liquid type*log10(concentration)", "log10(concentration)", and "bottle shape". You can see.

    undefined


    ■Pooling unnecessary terms into error

    In screening experiments, terms that are not significant in the fitted model may be excluded (considered as errors) in order to clearly determine the effects that influence the response. In JMP, you can remove the term from the model by selecting the term you want to delete in the report ``Effect Summary'' and clicking ``Delete'' at the bottom left.


    1. Delete the interaction “capacity*log10(concentration)” with the largest p-value (p=0.966)
    2. After performing step 1, the interaction with the largest p value is "Liquid type * Volume" (p = 0.384), so delete it

    undefined


    In steps 1 and 2, the main effect "type of liquid" was not removed even though it had a large p-value. This is because the interaction "liquid type*log10(concentration)" is included in the model. Generally, we do not remove a main effect if the model includes an interaction with that main effect. this Hierarchy of effects It's called.


    Below, we will consider a model with unnecessary terms removed.


    ■Interaction profile

    In this example, the interaction between fluid type and concentration is highly significant. It is useful to consider this phenomenon in terms of interaction profiles. From the red triangle button at the top left of the report Factor Profile > Interaction Plot It can be displayed in


    undefined


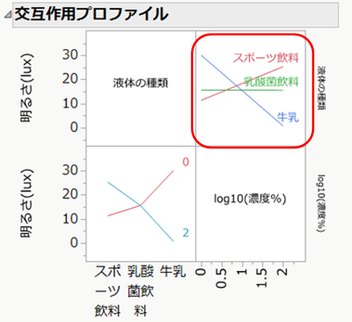
    If you look at the figure in the upper right circled in red, you can clearly see the interaction effect between liquid type and concentration.


    In the case of milk, the brightness tends to decrease as the concentration increases, but in the case of sports drinks, the brightness tends to increase as the concentration increases. For lactic acid bacteria drinks, there appears to be no relationship between concentration and brightness.


    ■Prediction profile

    Use predictive profiles to explore relationships between responses and factors.


    From the red triangle button on the left, Optimization and Satisfaction > Maximize Satisfaction By selecting , you can find the condition of the factor that maximizes the predicted value of brightness, which is the response, in the created model.


    The condition for maximum brightness is when 500ml of 1% milk is poured into a folded plastic bottle. The predicted brightness at this time will be approximately 34 lux.


    undefined


    As you know, milk contains fat and oil components. This oil and fat component is responsible for the brightness. This can be understood from the fact that in the past, oil was used as a fuel for lighting.


    In an emergency, it seems that adding a small amount of milk to a plastic bottle of water creates a very bright lantern. However, if you use milk itself (100% concentration), it will block the light, so you need to be careful.


    From screening experiments to optimization experiments

    However, it is unlikely that you will have milk on hand in case of an emergency. Water and sports drinks may be more commonly stocked in case of emergencies. Therefore, the next Part 2 Now, let's create a response surface model for sports drinks to investigate the capacity and concentration conditions for the brightest drink.


    Reference video for this experiment: What's the brightest way to turn a flashlight into a lantern? |Disaster prevention experiment [prepare] TV ] YouTube

    https://www.youtube.com/watch?v=NbmN2s-Pjz8


    by Naohiro Masukawa (JMP Japan)

    Naohiro Masukawa - JMP User Community

    This post originally written in Japanese and has been translated for your convenience. When you reply, it will also be translated back to Japanese.