cancel
Showing results for 
Show  only  | Search instead for 
Did you mean: 
Check out the JMP® Marketplace featured Capability Explorer add-in
Choose Language Hide Translation Bar
One-click export to Microsoft PowerPoint

In a previous post titled “Saving graphs tables and reports in JMP,” I shared with you how to copy/paste JMP content into PowerPoint. Now I want to follow up by showing how you can export JMP reports directly in to the .pptx file format. The export writes graphs, tables, text and outline titles directly from JMP to PowerPoint. 

Exporting to PowerPoint

If you use JMP on Windows: Click File > Save As…, select PowerPoint Presentation from the Save as type: drop-down menu, and save to the desired location.
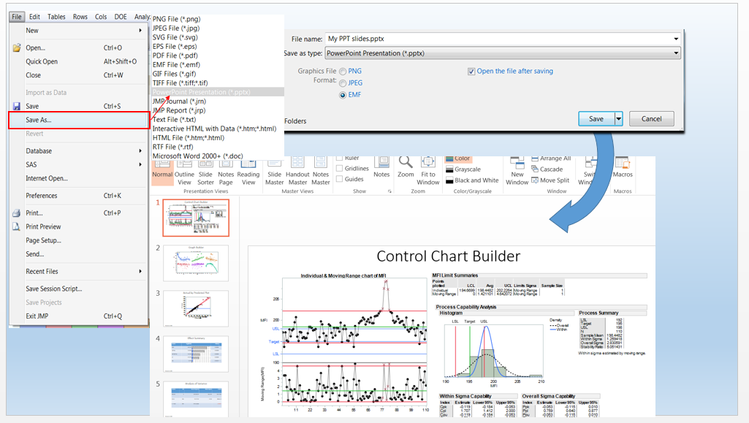
 

One-click-PPT.png


If you use JMP on a Mac: Click File > Export…, select the Microsoft PowerPoint option, click Next, and save to the desired location.

Some things to know about this:

  • Each element (i.e., graphic or table) of the report is placed on a separate slide.
  • Table contents are editable within PowerPoint.
  • Once content is in PowerPoint, you can update styles, move content around and better incorporate your own content.

Changing the Template Background

PowerPoint supplies most of the visual styling such as table colors, fonts, title size, etc., based on the template used. JMP ships with a default template. If you have a company standard template (or theme), you can easily change it by going to the Design tab in PowerPoint.

Last Modified: May 1, 2019 8:35 AM
Comments
BSwid
Level IV

Hi @MaryLoveless , this is very helpful.    How do I solve the extra white space that gets printed with this solution?  I'm using PowerPoint 2016 on a Windows machine & JMP 14.0.  I tried all three graphic export options and none solved this issue.


Graphic format options and results

  • PNG - the big whitespace issue. Waaaay off the bottom of the slide.  Hard to crop because PowerPoint wants to flip to the next slide when you scroll down.
    • My work around is select the image in PowerPoint, > Format (at the top) > color > set transparent color > then click the extra whitespace on the image.
  • JPEG and EMF - still whitespace, but the picture is shrunk to fit vertically on the slide.
    • My work around is to manually crop and then stretch enlarge the image.


Thanks.


JMP Community Graph Builder PowerPoint SaveAs WhiteSpace.jpg


gail_massari
Community Manager

From the Graph did you try FILE>SAVE AS>PowerPoint Presentation?  When you do that, you can edit the picture.  For example, I just dragged and dropped the simple Editable Graph Builder.pptx to fill the space.  I attached the .pptx file to this blog for you to see.

File Save As.png


BSwid
Level IV

Yes. That works fine when there is just one graph to save.
It's when trying to save multiple graphs that the problem occurs.  Unfortunately that's when the export would be most valuable; otherwise I could just right click on the graph, edit>copy graph and paste.  
Try that same process you did in the reply with a graph in which you have dragged a variable to Page to make multiple graphs of the same format, maybe sales by month where each page is the customer.  That should reproduce what I'm seeing.


For example, open Car Physical Data from the sample library, do graph build contour plot and then drag country to page and Save As PowerPoint.  The white space will be there.


bwwhite
Level II

I, too, would like to know how to get plots to PowerPoint without all the extra white space at the bottom. I created a graph in Graph Builder with a variable in the Page box, thus creating 10 plots. When I saved as PowerPoint, each plot was put nicely on a separate PowerPoint slide, but every plot image had this huge whitespace at the bottom as the earlier responder pointed out.


Frankly, I think this is a glitch that JMP needs to fix. I'm using Office 365 and JMP 14, the latest release.


Bruce

jschroedl
Staff

Hi, JMP developer here...


Yes, this is a bug in in JMP. It has been fixed in the forthcoming JMP 15 but unfortunately, I don't have a workaround to offer for folks using JMP 14. Sorry for the issue, I'm sure it's frustrating!


John

BSwid
Level IV

Thanks @jschroedl it's actually very helpful to know it's a bug and there isn't a better way or a work around.  Helps to know it's not just me doing something wrong and I can stop looking for an answer now.  Good to know it'll get fixed in JMP 15.   Thanks for letting us know.

Our company is relatively new to JMP and has a sizeable pool of users.  A few of us have the opportunity to use JMP more than others and are dubbed the experts.  So it's good for the morale of the group to get closure on an open question.


Thanks again!

nvi
Level I

Hi @MaryLoveless,

I have a fit curve report that generates multiple plots. When exporting the results to power point I get one plot per slide. Is there a way to group the plots (other than copy-paste in power point) to show several plots per slide?


Thanks,

Nuria

BHarris
Level VI

Not sure if I'm appreciating the nuance here, but try this:  go to Preferences -> Reports -> "Transparent background for report PNG images", then in Graph Builder, right click under the legend and select "Copy picture" and paste into PPT.  That's how we do it, and the background comes through as transparent and looks great.

hogi
Level XII

In the GraphBuilder Toolbar Add-In there is a function now which allows a user to send a graph or report to Powerpoint.
(win only)

The content will be inserted on the current slide.
Graph Builder Toolbar 


hogi_0-1678381983793.png


chris_dennis
Level III

Trying to follow this link get access denied.  How do you access the tool bar shown on the left?

hogi
Level XII

Sorry, I corrected the link.

In addition: 
seems that you have to wait some more days.
I just noticed that the latest version is not yet available from the site.

BHarris
Level VI

Elsewhere on the forums someone helped me build this script that does exactly what we've always wanted, i.e. find the last Graph Builder window, resize the entire plot (not just the individual subplots) to a fixed pixel size, and then copy the plot to the system clipboard.  After running the script, we switch to PPT, click the content placeholder to put the image into, and ctrl-v (paste).  Very smooth and fast for Graph Builder windows!


//!

Names Default to Here( 1 );

win = Get Window List();

// find graph builder windows
graphs = Filter Each({w}, win,
	If(Length(w << XPath("//OutlineBox[@helpKey='Graph Builder']")) > 0, 1, 0)
);

// get the last Graph Builder
last_gb = graphs[N Items(graphs)][OutlineBox("Graph Builder")] << Get Scriptable Object;

// set size
last_gb << Fit to Window("Off");
// last_gb << Show Control Panel( 0 );
last_gb << Size(1000,800);

// copy picture
frame = (graphs[N Items(graphs)] << XPath( "//GraphBuilderBox" ))[1];
frame << Copy Picture;
hogi
Level XII

Graph Builder Toolbar 
Improved functionality of  Send To PPT:

  1.  CTRL +  click on the images in PPT to open again the corresponding JMP file
  2.  in JMP, a table script is added which creates the current graph 
    [in PPT, please check the Alternative Text to get the name of the script]


hogi_0-1721157042293.gif