Quick eclipse path map
Every time, my colleague would say “You could do that with a script.”
JMP has adopted a Unicode character.
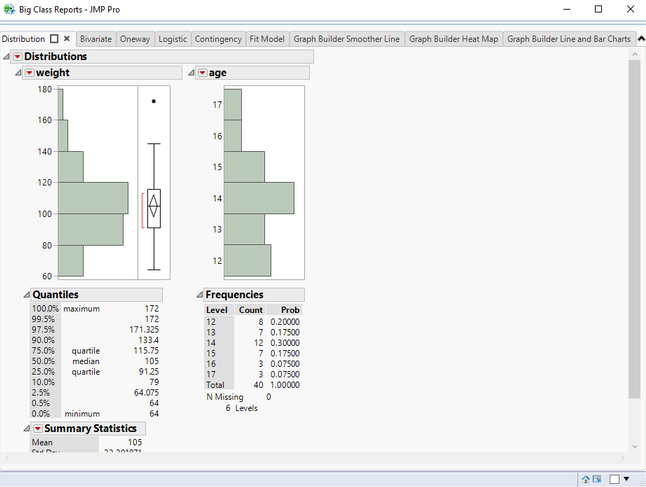
Introducing a new JMP add-in to run all the scripts attached to your data tables, and generate tabbed, tiled or multi-window reports!
Are more students taking the AP computer science exam?
Two animated GIFs show two ways to make a clustered bar chart.
Watch two animations for creating a bullet chart with JMP Graph Builder.
Data visualization helps policy makers understand impacts of different models.
See a list of articles and resources to get you started on building a UI.
juliagong
Statisticians from JMP are at JSM 2017 in Baltimore.
Are baseball games getting longer each year? And what affects game length?
"We need to change the world by making it better for practitioners," says Elea Feit.
JMP has made a lasting impact in the New Mexico Public Education Department.
I rank NBA teams using Generalized Regression and compare results from two seasons.
Ready to learn something new? Attend Discovery Summit, Oct. 17-20 in St. Louis.
See how Professor Saraiva applied his statistical perspective to turn data into understanding and value as a member of Portugal’s parliament
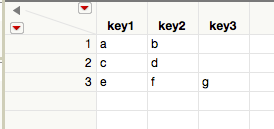
Export a JMP Data Table to Excel, and import the workbook back into JMP, while retaining all original column properties, table variables, and table scripts.
I recently posted an add-in to log each launch of JMP.
As I was developing it, I thought I was being clever by storing the logging information as an associative array.
Here's an example of what's in a single log file.
["Bitness" => "64-bit",
"Build Information" => "Jan 9 2017, 00:53:08, Release, JMP ",
"Date" => "06/06/2017 08:05:03 AM",
"Host" => "Windows",
"Hostname" => "computer1", ...
Discovery Summit features keynote talks by exciting thought leaders in statistics, technology and innovation, Oct. 17-20 in St. Louis.
Peter Goos is a top researcher on statistical design and analysis of experiments.