cancel
Showing results for 
Show  only  | Search instead for 
Did you mean: 
  • Don’t miss your chance to experience Discovery Summit Europe at our best available rate! Early bird registration through 31 Oct.
  • Image to Table JMP extension imports single or batch images as data tables. Useful to extract curves from pictures or convert image data to curve data to use in analyses like Functional Data Explorer. Download and install the extension.

JMPer Cable Blog

A technical blog for JMP users of all levels, full of how-to's, tips and tricks, and detailed information on JMP features
Choose Language Hide Translation Bar
XanGregg
Staff
How to make a clustered bar chart in JMP

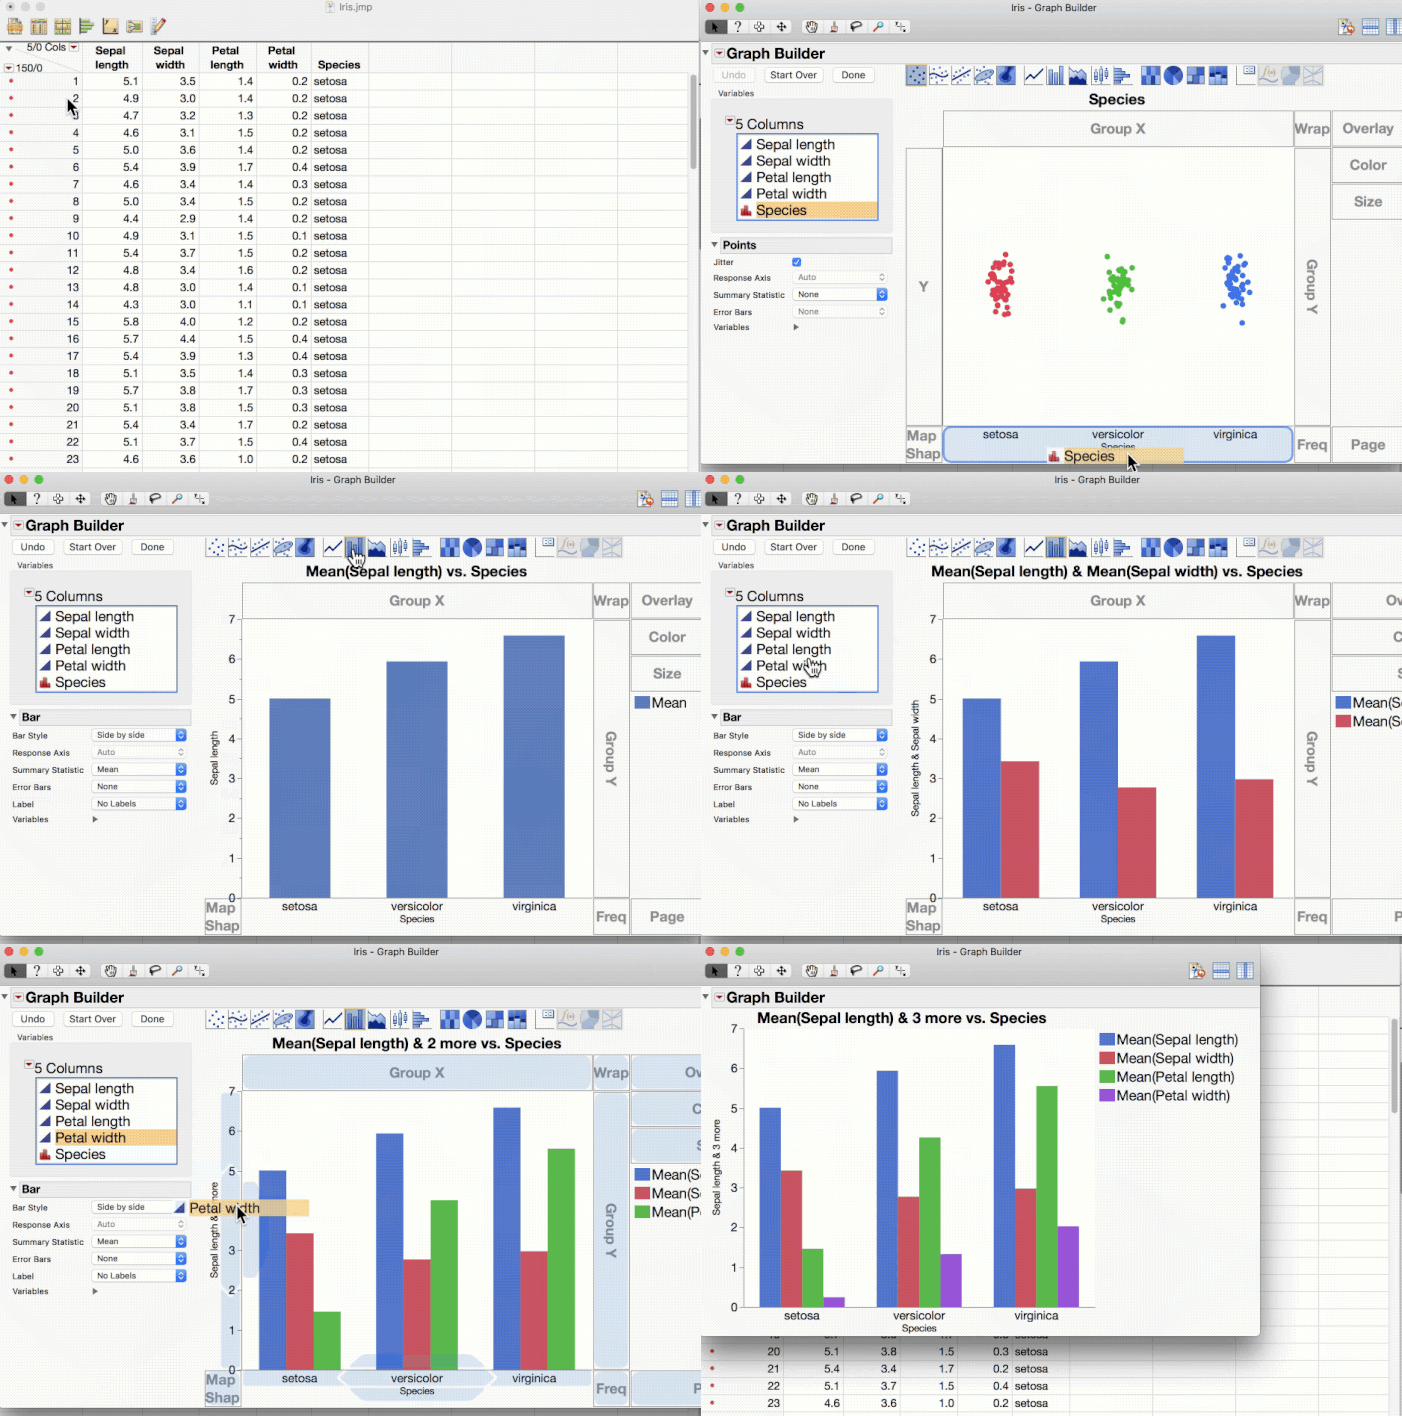
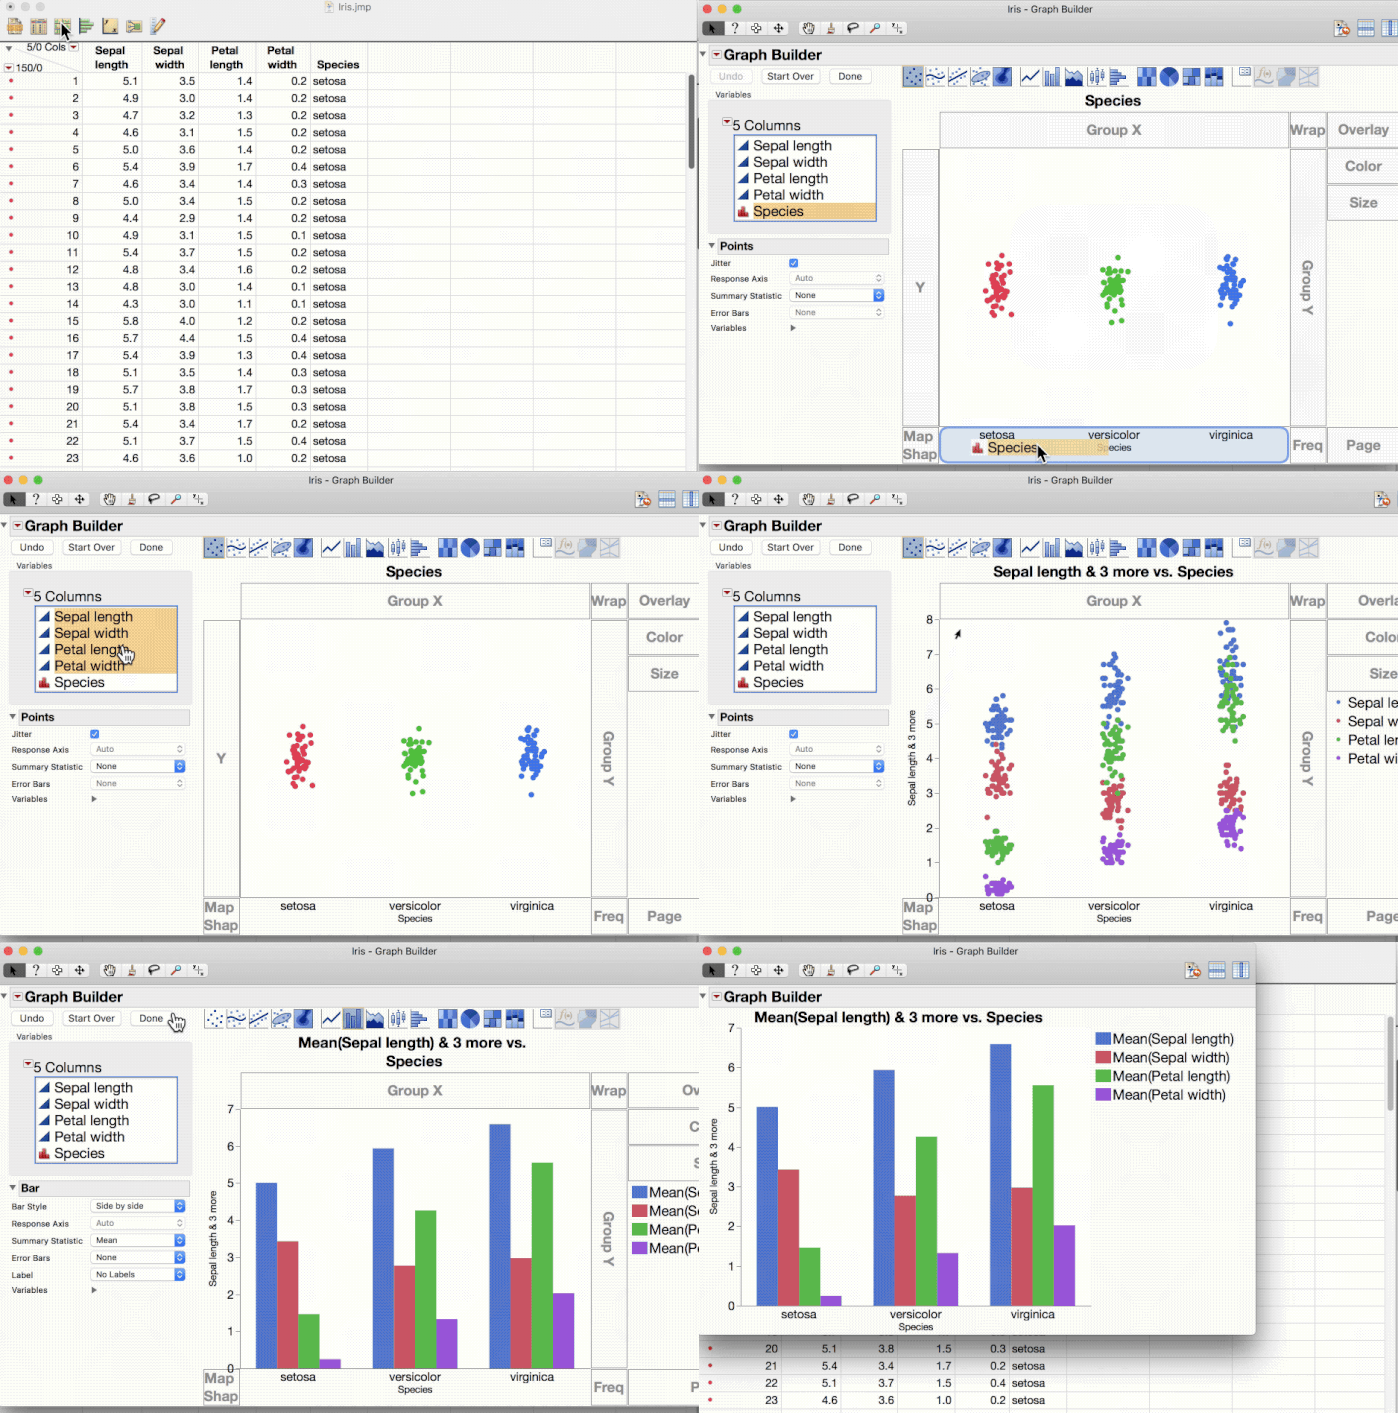
Here are two animated GIFs showing two ways to make a clustered bar chart (also known as "grouped bars" or "side by side" bars) in JMP. The basic idea is to provide a single X variable and multiple Y variables, and Graph Builder will use the side-by-side arrangement by default (see the "Style" property for other arrangements).

The first animation drags in the Y variables one by one, using the "merge" drop zone just inside the Y axis.
ClusteredBars1.gif


 The second animation drags in all the Y variables together.
 

ClusteredBars2.gif


Last Modified: Aug 9, 2017 1:28 PM