Due to the recently reported Microsoft outage, users may be temporarily unable to access My JMP or experience a delay receiving their verification codes. If you have previously installed JMP on your computer, this outage should not impact your ability to access the software. My JMP services will be restored as soon as Microsoft resolves this issue.
Image to Table JMP extension imports single or batch images as data tables. Useful to extract curves from pictures or convert image data to curve data to use in analyses like Functional Data Explorer. Download and install the extension.
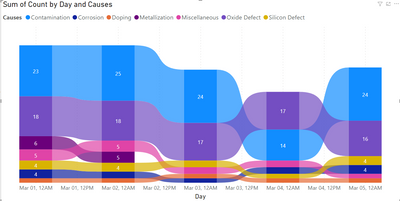
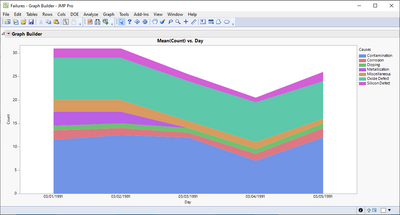
I would like to have possibility to use similar visualization as PowerBI provides with Ribbon Chart which is quite close to ordered stacked bar chart with some visualization between different bars (easier to see changes over x-axis than cluster bar charts).
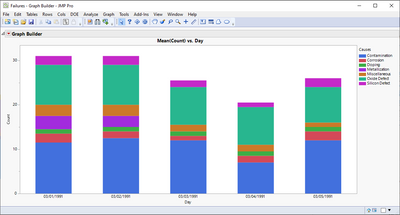
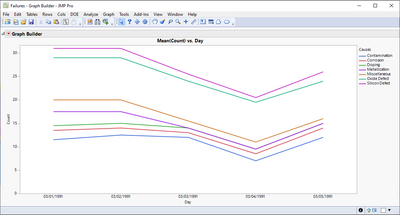
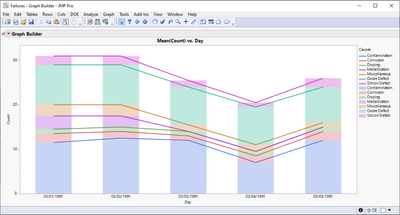
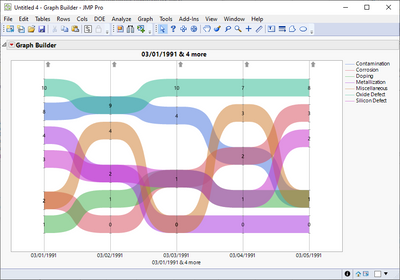
JMP data split and parallel plot with columns set as Ordinal:
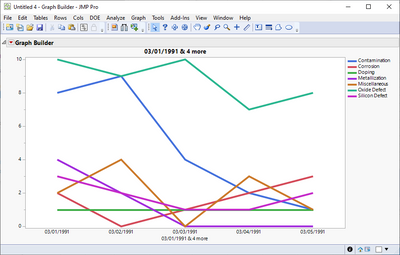
JMP split data with lines:
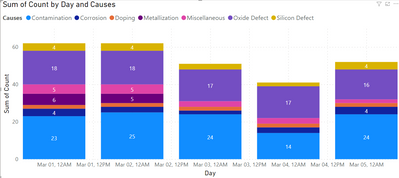
PowerBI stacked bar chart:
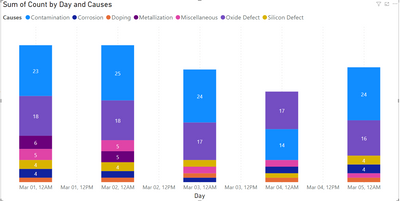
PowerBI ribbon chart with connectors set invisible (ordered stacked bar chart):
PowerBI ribbon chart:
Out of these I prefer Ribbon chart as it clearly shows if ordering has changed in x-axis (it also has quite useful tooltips which shows the change).
I tried to find what name that chart usually has and I came across Bump Chart, area bump chart, alluvial diagram and sankey bump chart. Bump chart and alluvial seem to be quite different but I think they are also visualizations that could have their place JMP's Graph Builder.