Is JMP a Spreadsheet Program? Can JMP work as an FMEA template?
It's no secret that FMEA (Failure Modes and Effects Analysis) is typically work that resides in spreadsheets. It's also no secret that JMP is Not a Spreadsheet. However, the data table does look suspiciously similar to a spreadsheet, and it can do some spreadsheet-like things. Often, JMP users tend to think of the data table as just the place where data is stored, with all the fun things happening in the platforms and reports that JMP has. After a recent discussion with @scwise, I realized that the JMP data table is a great place to do FMEA work.
The Basics
Consider the example pictured below. This is a very simple FMEA, based on making a cake with worn-out hot pads/oven mitts. This is fairly basic FMEA stuff: the RPN scores are formulas, but no other customizations have happened yet.

A few tweaks can make the FMEA table more useful:
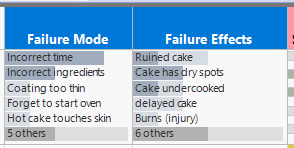
- Multiple Responses: The Failure Mode, Failure Effects, and Causes columns all contain comma-separated lists. Changing the modeling type for these columns to Multiple Response allows JMP to separate all these responses automatically. This means that analysis platforms and the header graphs will update to show recurring values, which is helpful for spotting trends such as "Incorrect time" in the Failure Mode column. Using multiple response columns speeds up both data entry and analysis.
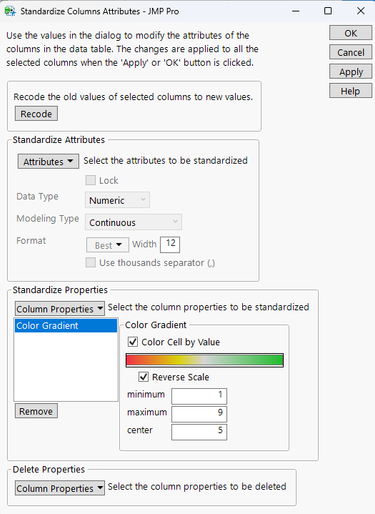
- Coloring cells: Adding the Color Gradient property to the numeric columns helps highlight problems. A trick to making this faster is to select multiple columns then use the Standardize Attributes tool, which changes all specified columns at the same time.

- Once the cell gradients are applied, it's easier to see that the biggest problem is worn out hot pads, with an RPN of 567.

- Coloring Column Headers: JMP 18 now has the ability to color column headers, available by right-clicking on the text of the column header. This allows highlighting specific columns, which makes the whole thing more readable.
Interesting Implications
Since JMP isn't a spreadsheet, there are ways to interact with the data that otherwise can't be done.
- Recode: As a first example, the Recode tool allows for quick detection and correction of misspelling, as well as combining similar entries, which immediately results in updated header graphs:


- In this case, selecting the most common failure modes in header graph interactively shows the top failure effects. Purchasing timers for the process would be a good improvement action, since it would target multiple failure points at once.

- Word Clouds can also show themes quickly and visually (e.g., incorrect time in the cloud shown below). Since this is JMP and not a spreadsheet, the script for this word cloud can be saved to the data table, and it can be re-made any time with fresh data.
- Dashboards: It's also easy to make dashboards in JMP, making it easy for a team to use the FMEA as a tool for improvement. In the picture below, a team can conclude that purchasing new hot pads will target the highest current RPN.
- Scripts: There's even the ability to add scripts to the data table or the dashboard. The button on the dashboard moves the associated scores and actions for any selected rows to the previous/completed section of the template, making the tool more useful and faster to fill out.
Conclusion
JMP is actually really well suited as a platform for FMEA work. Because JMP does many spreadsheet-like things, such as formulas and cell colors, it can easily record and FMEA. However, because JMP isn't a spreadsheet, it can do so much more, like dashboards and analysis. In fact, the next time I do an FMEA, I'm planning on using JMP.
Please feel free to use and customize the attached FMEA template. I'd love to see any improvements posted in the comments.