The biggest addition to Graph Builder in JMP 13 is a new element for parallel coordinates plots. JMP has long supported parallel coordinates plots as a separate platform, and integration into Graph Builder both expands the functionality and leverages core Graph Builder features like legends and grouping.
 Categorical and continuous variables graphed with parallel coordinates
What is a parallel coordinates plot?
A parallel coordinates plot is an efficient way to visualize high dimensional data; however, it’s one of those chart types that requires a little explanation. For me, the first step in understanding parallel coordinates is to characterize “normal” graphs as using perpendicular coordinates. For comparison, here is the same two-variable data set shown using perpendicular coordinates and parallel coordinates.
 Perpendicular weight and height
  Parallel weight and height
In perpendicular coordinates, each observation is represented by a point at a two-dimensional location; in parallel coordinates, each observation is represented by a line connecting two (or more) one-dimensional locations. I colored three observations in the above plots to help show the correspondence. The orange observation, for instance, is at weight=80 and height=51 in both graphs. For only two variables, perpendicular coordinates are far better, but this simple example helps to illustrate how the variables are encoded in the chart.
Parallel coordinates can be extended to any number of dimensions since all the dimensions are parallel to one another. For perpendicular coordinates, even three dimensions is pushing it on a flat surface. For more dimensions we can start adding color, size and trellising, but each of those loses some efficiency over pure positional representation, and we eventually run out of visual dimensions anyway.
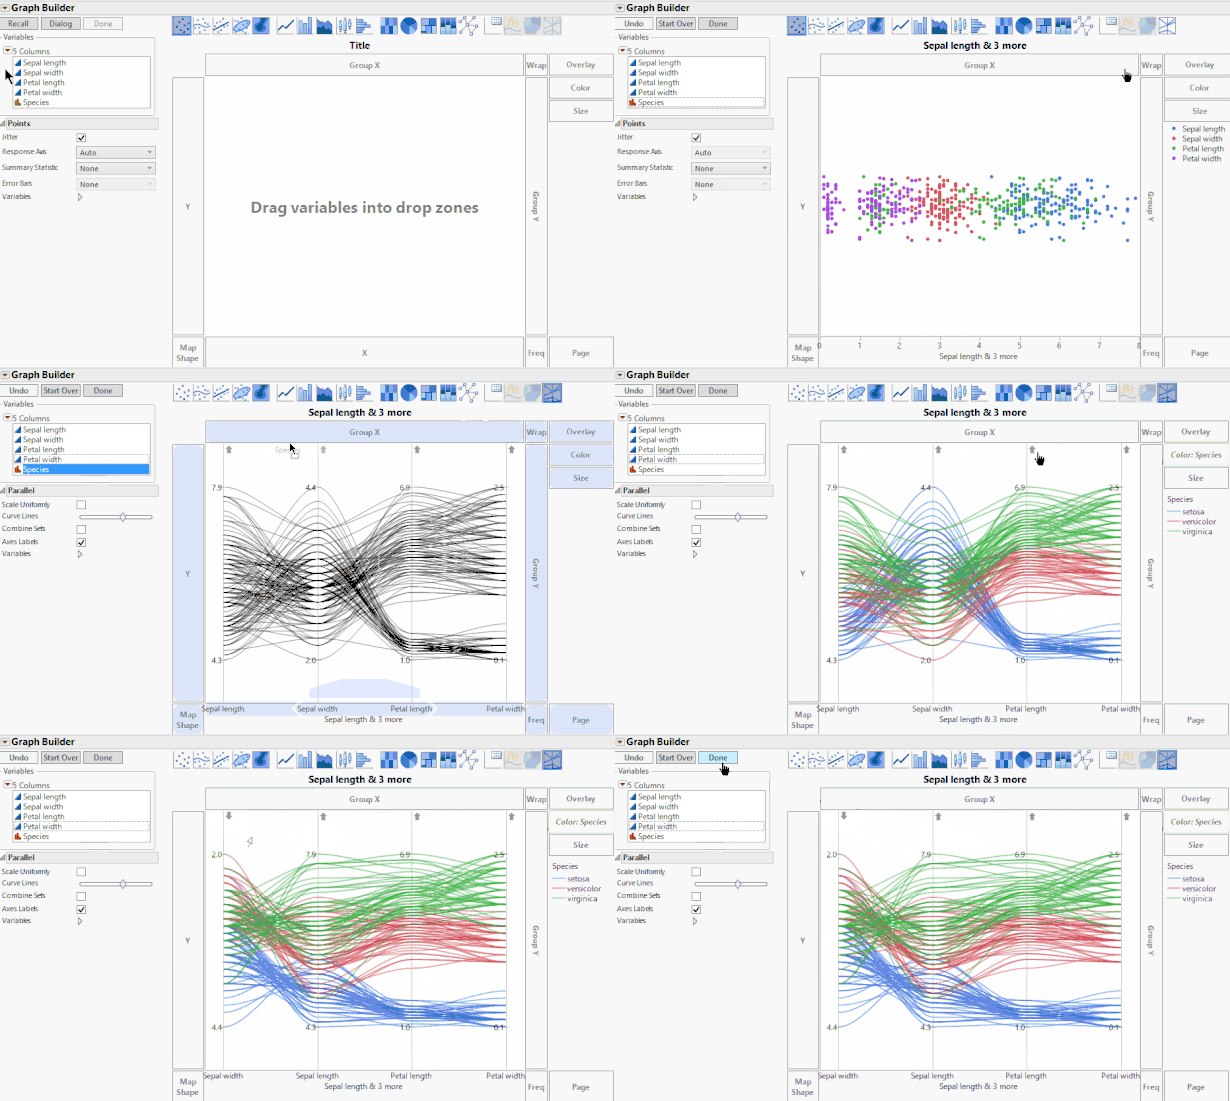
Here’s a GIF showing the creation of a parallel view of the Fisher iris data set showing four continuous dimensions plus color. All the continuous dimensions participate equally. Order is important for seeing patterns, so interactions include the ability to directly rearrange and flip individual axes.
 Creating a parallel coordinates graph in Graph BuilderParallel coordinates can be useful for getting a quick view of an entire data set, but the more common use is in visualizing clusters, such as the iris species above. When the clustering has been computed by an algorithm, a parallel coordinate view can be a useful diagnostic.
Categorical variables
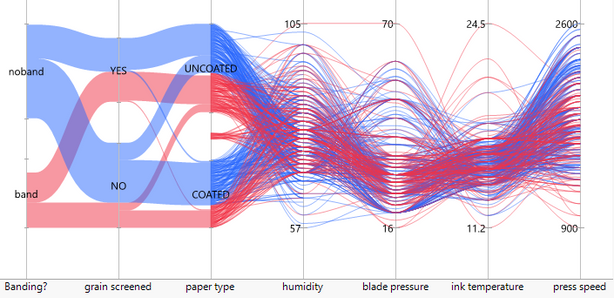
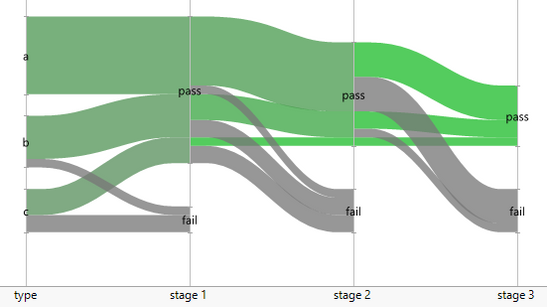
Categorical variables can be mixed with continuous variables, as shown in the first image of this post. When two categorical variables are next to each other, they are connected with a band whose width is proportional to the number of items. With some data sets, you can use this feature to get a Sankey-type chart.
 Using parallel coordinates to visualize a flow
I hope you will give parallel coordinates a try in JMP 13, and let me know what you think. Want to try JMP? Download the free trial.