- JMP will suspend normal business operations for our Winter Holiday beginning on Wednesday, Dec. 24, 2025, at 5:00 p.m. ET (2:00 p.m. ET for JMP Accounts Receivable).
Regular business hours will resume at 9:00 a.m. EST on Friday, Jan. 2, 2026. - We’re retiring the File Exchange at the end of this year. The JMP Marketplace is now your destination for add-ins and extensions.
JMP Blog
A blog for anyone curious about data visualization, design of experiments, statistics, predictive modeling, and more- JMP User Community
- :
- Blogs
- :
- JMP Blog
- :
- My excuse for not being good at basketball (or an analysis of free throws vs. pl...
- Subscribe to RSS Feed
- Mark as New
- Mark as Read
- Bookmark
- Subscribe
- Printer Friendly Page
- Report Inappropriate Content
I’m taking a week off from my "Learning from my mistakes" blog series, because it’s almost time for the NCAA basketball tournament! I can’t miss the opportunity for a basketball post.
I grew up in Indiana, and I now live near Lexington, KY, so I’m a natural basketball fan. As a young kid (many, many years ago), I dreamed of making the final shot to win the Final Four. Glory and fame would be mine!
Alas, it wasn’t meant to be, as I never was a very good player. My excuse was (and is) to blame it on my height. You see, I’m only about 5’6” (167 cm) tall on a good day. We all know that basketball is dominated by players over 6 feet tall (most approaching 7 feet and up). Short players like Muggsy Bogues or Spud Webb are the rare exception.
There are obvious reasons for the height advantages: better rebounding, playing “above the rim,” wider arm span for playing defense, bigger bulk for moving players around, etc. The shorter players can claim a few advantages over the bigger players (such as quickness), but these days the game is definitely a “big man’s game.”
Still, I wonder whether the game is “rigged” to favor taller players, hence the reason that I was never a good player. So I decided I would try to prove a simple case: that taller players have an advantage over shorter players when they shoot free throws.
The Desired Output Plot
What I am looking for is a plot of the "operating window" for free throws, so that I can compare the window for a tall player vs. one for a short player. This will involve modeling combinations of the initial velocity of the basketball against the initial angle (or trajectory) of the ball, determining whether the shot is a "Make" or a "Miss," and plotting the results. Ultimately, this should result in a plot like this:

Further, we should be able to animate the shot, something like this:

Are you interested in how to do this, and what it all means? Read on!
Developing a Model
For my model, I used US men's basketball court and ball dimensions:
-
Free throw release point: 15 feet (horizontally) from the front surface of the backboard
-
Goal diameter: 18 inches
-
Goal height: 10 feet (vertically) off the ground
-
Center of the goal: 15 inches in front of the backboard
-
Basketball diameter: 9.55 inches
I introduced a few assumptions and constraints to simplify the model:
-
Left-to-right variation of the shot is not allowed, so all we end up with is a straight-on shot at the basket. This simplifies the problem to two dimensions.
- All other factors such as wind resistance, under/over-inflated balls, rotation on the ball, etc., were disregarded.
There were three input variables to the model:
- The “launch” height of the basketball (i.e., height above the floor at release point)
- I looked at two heights: 6.5 feet above the floor (which is about my release point, arms extended), and 8.5 feet from the floor (where the big guys shoot)
- The release velocity of the basketball
- The release angle of the basketball (or initial trajectory)
The output of the model (for each combination of release height, initial velocity, and initial trajectory) was a categorical value of "Made" or "Miss."
Equations of motion were the standard ballistic equations. These are shown in the attached Word document.
Make/Miss Criteria
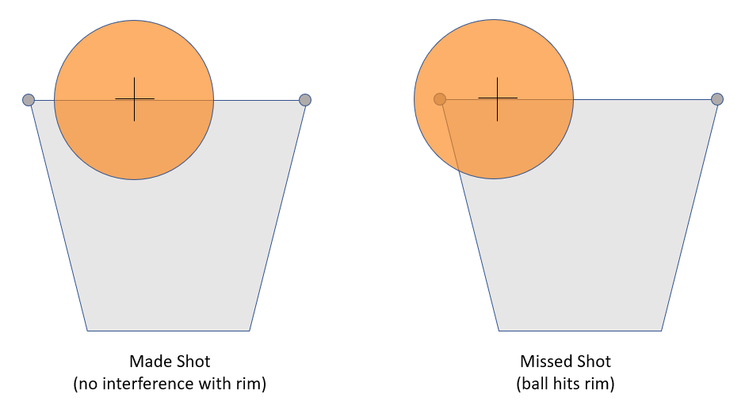
For a shot to be "Made," I required that the shot "swish" through the net without contacting the rim at all. This criteria seems simple at first: Does the ball fit between the foremost and aft-most positions of the rim when the center of the ball is at rim height and on a downward trajectory? (Remember that we are only looking at perfectly centered (left to right) shots, so the rest of the rim is of no importance.)

But the ball shown in the “Made Shot” diagram above may not have actually “swished.” Consider that the ball’s trajectory at the moment of this image might have been relatively “flat,” as shown below:

So we also have to account for the final angle of the ball, and the fact that it narrows the window W for a swished shot:

So the criteria are that when the center of the ball is at the height of the rim and on a downward trajectory:
- The X position of the center of the ball must be between the front and back of the rim.
- W has to be at least as large as the ball diameter.
- The ball cannot touch either side of the narrowed channel described by the final angle and the diameter of the rim.
Implementing the Model
The ballistic equations and constraints were coded into JMP Scripting Language (JSL). The script (ballistic calcs.jsl) is attached to this post, in case you want to try running it yourself. The code is pretty straightforward, and not at all optimized for speed (hence it may take some time if there are many combinations of velocities and trajectories to evaluate). The code is well-annotated if you want to dig through it. Primary components include these:
- A custom user input panel is presented for controlling operations.
- A new data table is created, containing new columns for each variable that will be stored.
- Two nested loops, one for stepping through initial ball velocities, and one for stepping through initial trajectory angles.
- Within these loops, all ballistic calculations are made to get the ball to the final position (i.e., at rim height, downward trajectory).
- Final ball position and trajectory are then used to determine if the shot “swishes” as defined previously.
- A categorical “makemiss” variable is set to either “Make” or “Miss,” depending on the calculated outcome.
- All variables are stored in the data table for this particular combination of initial velocity and initial trajectory, including the makemiss variable.
- Finally, once all the calculations are completed and results stored in the new data table, I plot the velocity vs. trajectory operating window, and add a script to the data table to easily recreate the plot.
Once the calculations are finished, the data table contains all results, which can then be plotted. I ran the code for the following cases:
|
Case |
1 |
2 |
|
|
|
|
|
Initial Height, ft |
6.5 |
8.5 |
|
|
|
|
|
Initial Velocity, fps |
|
|
|
Lowest |
20 |
20 |
|
Highest |
50 |
50 |
|
Increment |
0.05 |
0.05 |
|
|
|
|
|
Initial Trajectory, degrees |
|
|
|
Lowest |
35 |
35 |
|
Highest |
89 |
89 |
|
Increment |
0.05 |
0.05 |
This resulted in two data tables, one for each Initial Height, and each containing nearly 650,000 rows (one for each combination of initial velocity and trajectory).
(Note: Each of these cases required about two minutes to complete on my laptop.)
Free Throw Tolerance Window Output
I wanted to see the “free throw window,” showing a scatterplot of Initial Velocity vs. Initial Trajectory, with dots color-coded according to make or miss. That is easily done in Graph Builder in JMP. Let’s talk about the “tall person” tolerance window:

- At low velocities (22-24 fps), the angle for making a shot is relatively low. This makes sense, as shooting a soft shot at a high trajectory won’t make it to the basket.
- At high angles (above 70 degrees), the initial velocity must be high. In this case, we are shooting a very high shot. (In fact, as the angle approaches 90 degrees, the initial velocity climbs toward infinity.)
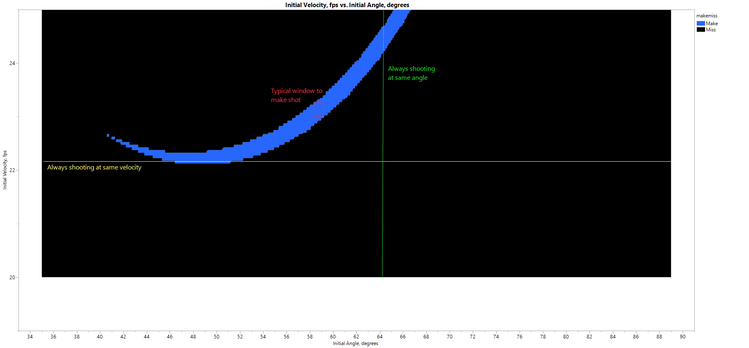
If we expand the above plot to emphasize the low velocity region:

Now we can better see:
- The range of angles required to make a shot, if the shooter always shoots at the same initial velocity (yellow line is an example).
- The range of initial velocities required to make a shot, if the shooter always shoots at the same initial angle (green line is an example).
- A typical window of allowable ranges of velocities and angles, if a shooter is reasonably consistent (red box is an example).
Comparing Short to Tall Performance
I manually combined results for the two test cases (short vs. tall shooters) into a single graph:

Now we can begin to see the differences between short and tall players:
- Short players have to shoot harder and at higher angles than taller players (of course, we all knew that already).
- The two curves converge as the launch angle increases (makes sense -- both players are launching very high shots, so starting height is of less importance).
- Generally, the window (i.e., blue area) for tall players is somewhat larger than the window for short players (yellow area).
At this point, I was feeling pretty good about my thesis, but the contour visualization had an odd behavior. Notice in the above plots (particularly in Figure 7), as we go from low to high angles, the blue curve seems to start at a velocity of about 22.5 fps, then acceptable velocity drops slightly as angle increases, before increasing again. I wondered if this was real.
Animating the Shot
To investigate the oddity, I chose to look at a tall person shooting free throws at a constant initial velocity, varying only the angle of the shot. The motion of the ball is easy to calculate (a simple parabola), so I calculated the x-y position of the ball over time for a given angle. I repeated this for a number of angles, all using the same initial velocity and launch height of 8.5 ft.
I wrote a second script (animation.jsl, also attached to this post) that generated this data and stored it in a JMP data table. I then used a bubble plot to animate the results (with each new shot offset slightly in time), and stored it in a GIF file.
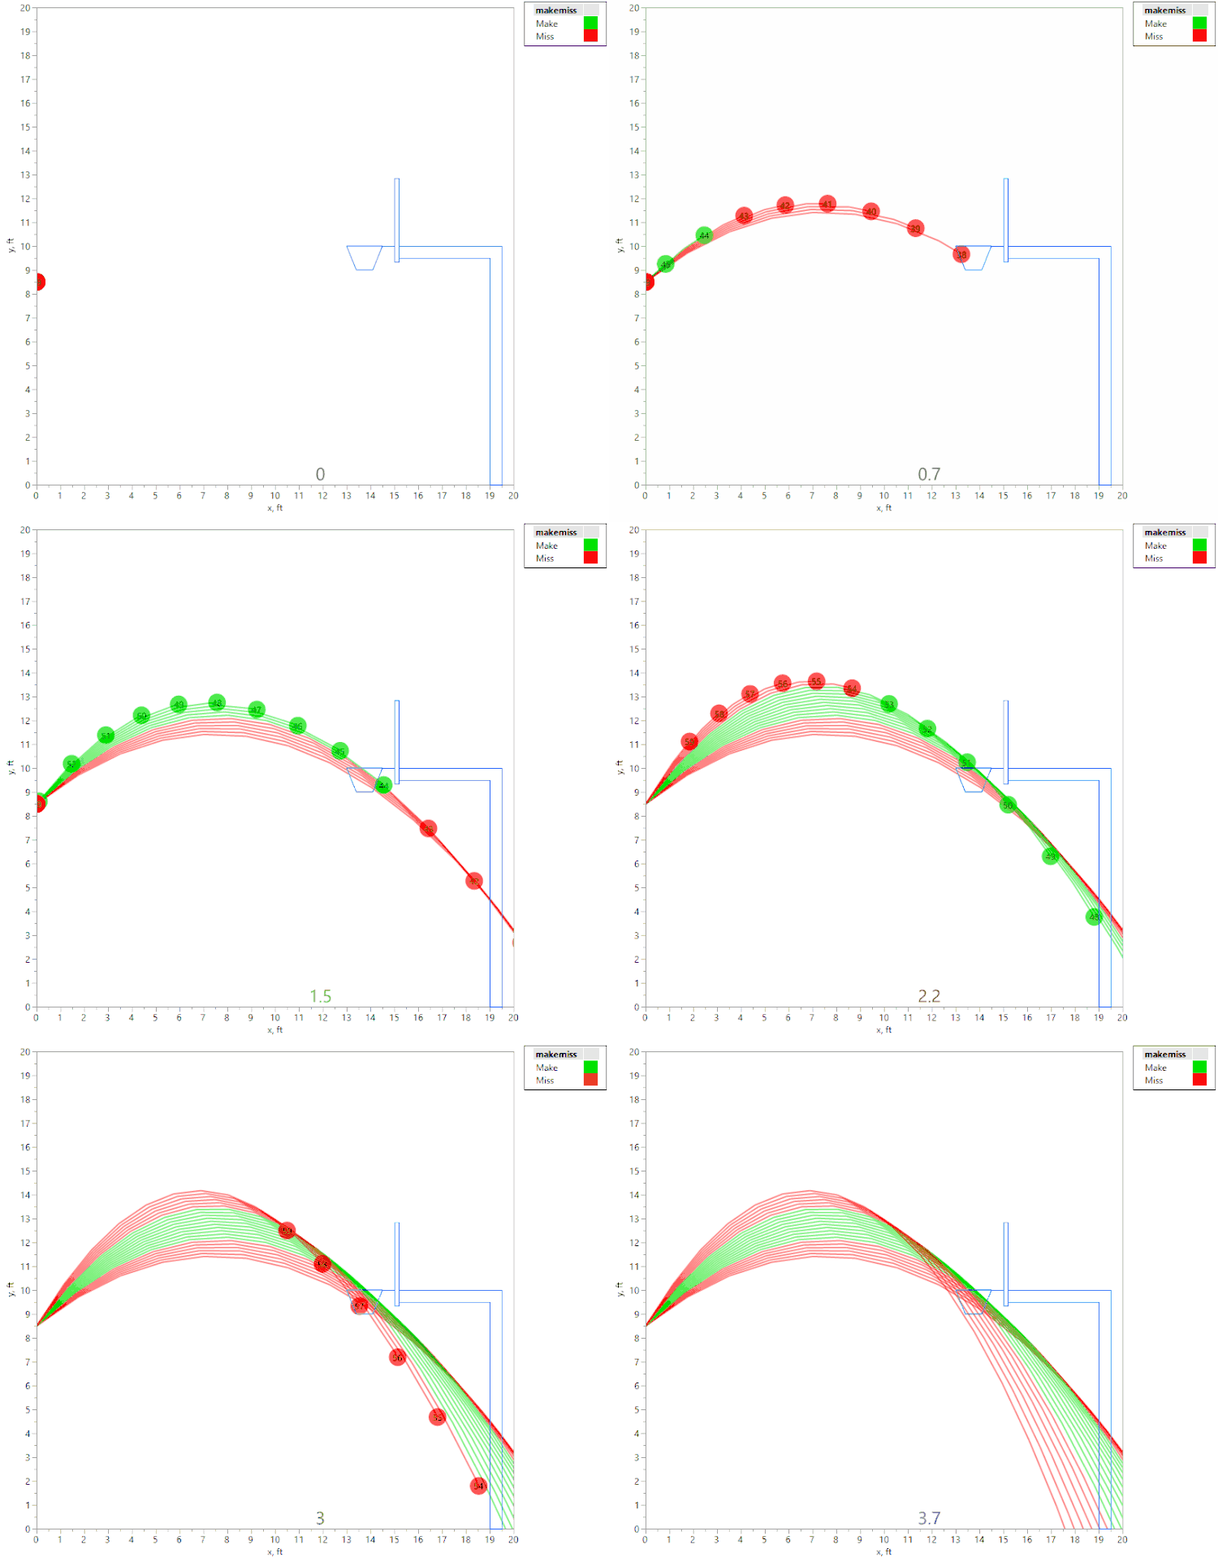
The first animation shows a tall person (release point 8.5 ft above the floor), shooting the ball with an initial velocity of 22.3 fps:

The above animation shows a number of shot attempts, all with the same initial velocity, as the shot angle is changed. (Each shot is labeled with the initial launch angle, in degrees.) If the initial angle is too shallow or too steep, the shot hits the front of the rim (hence is considered a “miss” since it didn’t “swish.”) Green shots are "Makes," and red shots are "Misses." If the angle is just right, the ball swishes through the hoop unobstructed.
However, if we raise the initial velocity just slightly (to 22.4 fps), we get this animation:

Here again, we see that if the angle is too shallow or too steep, the ball contacts the front of the rim. However, we also see that there are actually two regions of initial angles that result in a “make,” separated by a region where the ball hits the back of the rim. This was an unexpected result, and I would not have noticed it without the visualization tools in JMP!
Does Real Data Back Up the Findings?
Based on the windows shown in the plots above, I was feeling pretty good that a short player has a tougher time making free throws than a taller player. Of course, there is abundant data to show whether this is true or not.
I downloaded Player Height and Lifetime Freethrow Percentage for NBA players born after 1950, who had at least 1000 free throw attempts in their careers. I then plotted Height vs. Percentage using the Fit Y by X platform:

Alas, my thesis isn’t proven after all. There is a pretty clear trend of short players shooting better free throw percentages than taller players. In fact, if my thesis were true, then older players like Rick Barry (who shot free-throws under-handed) would have had a very poor percentage. (Barry shot 90.0% throughout his career.)
Clearly, there are other effects at play. Some of the model assumptions are detailed above. Others might include:
- Time spent practicing free throws
- Eye-hand coordination
- Motivation (perhaps short players work harder at free throws to make up for other on-the-court deficiencies)
Conclusions

In this case, my model might be useful if I try to argue my point at the local pub. But clearly my ballistic model was wrong. There are many other factors at play that determine the ability to hit free throws in basketball.
I guess I need to admit that I’m just not all that great of an athlete. Still, I hope you enjoyed the trip, and maybe got some ideas about how JMP might be a useful tool for your data exploration needs.
In the meantime…chess, anyone??
You must be a registered user to add a comment. If you've already registered, sign in. Otherwise, register and sign in.
- © 2026 JMP Statistical Discovery LLC. All Rights Reserved.
- Terms of Use
- Privacy Statement
- Contact Us
