The first episode in this series on Greenhouse Gas Emissions focused on temperature deviation. In the second episode, I discussed trends on nuclear energy trends worldwide. Particularly interesting was the dismantling of nuclear reactors in Germany since 2011 following Japan’s Fukushima Daiichi nuclear disaster. In this episode, I illustrate the renewable energy transition trends in Europe and globally.
After deciding to shut down nuclear reactors, Germany aimed to close the gap in production with energy transition (renewable energy), also called “Energiewende.” Germany invested greatly in solar and wind energy. Using data from Wikipedia that examined solar energy trends over the last 15 years in the EU, I could clearly see that Germany has been the leader in the EU since 2011.

Wind power continues to be a growing trend. Since 1998, Germany constantly invested in building new wind parks or wind farms. Using data from Wikipedia, the graph below demonstrates this trend very nicely, showing Germany in the lead, followed by Spain, UK and France.

This trend not only exists in Europe but also worldwide. Data from ourworldindata.org nicely shows this trend extending to every continent. I have to confess that I did not show hydro or biomass and geothermal energy generation. In fact, in some countries (such as Iceland), those renewable energies are the most predominant. In this snapshot of worldwide renewable energy generation since 1965, we actually see that hydro energy generation is the worldwide leader in renewable energy generation, followed by wind power.

Finally, how much of our primary energy generation comes from renewables? The chart below shows the overall share of primary energy consumption that comes from renewable technologies – the combination of hydropower, solar, wind, geothermal, biofuels and other. The top countries are Iceland and Norway, with a respective mean of share of 59.9% and 66.5%. By hovering over those countries, we can clearly see the trend.

It also tells me that Germany still has a long way to go. Its percentage of primary renewable energy consumption was 17.5% in 2019 (using the Data Filter on year), which is far behind the top two countries: Iceland (79%) and Norway (66%).
Finally, it was interesting to determine the yearly overall trend of the percentage of primary renewable energy. Are there countries with a steady increase or decrease of primary renewable energy consumption? I put some indicators in the data table to make it easier to read, such as:
- Colorizing the years from red (1966) to black to green (2018).
- Marking the year 1965 with a black “-“ minus sign.
- Marking the year 2019 with a black “^” caret sign.
Displaying the data in the Graph Builder as shown below, I could clearly see many countries with positive trends (with the caret on the top); however it was a little hard to distinguish countries with a positive versus negative trend.

Therefore, I did a final analysis, splitting the initial data to make a column for each country. I further analyzed the data with a multivariate analysis to obtain the Pearson correlation coefficients from the percentage of renewable energy consumption of all countries based on the year. A positive trend has a positive correlation coefficient, while a negative trend has a negative correlation coefficient.

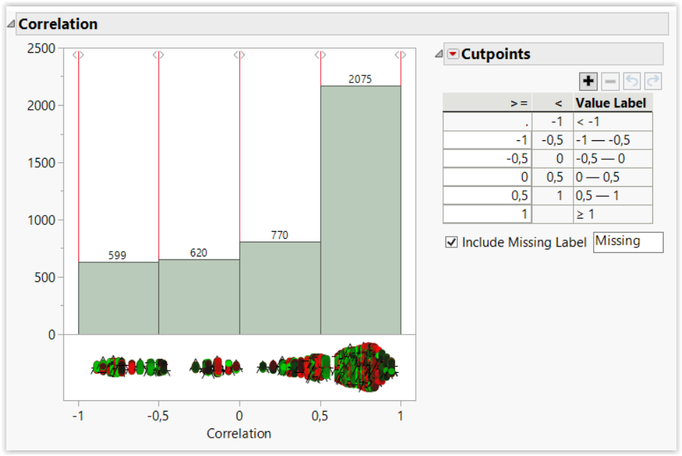
I generated a new data table with the Pearson correlation coefficients and joined it to the initial data set. To get clusters of positively versus negatively evolving countries, I used the binning formula (new in JMP 16) that allows the correlation coefficients to be binned into four different groups: -1 to -0.5; -0.5 to 0; 0 to 0.5; 0.5 to 1.

I can now use this cluster column as a Local Data Filter to view positive or negative trends of primary renewable energy consumption. Below is an example of countries with positive renewable energy consumption trends.

I was very happy to see that Germany, where I live, is one of the countries in the category of very positive renewable energy consumption trends.
In some wealthy countries, like in Switzerland and New Zealand, production of renewable energy varied and sometimes decreased (see below). In Switzerland, based on the estimated mean production level, hydropower still accounted for almost 90% of domestic electricity production at the beginning of the 1970s, but this figure fell to around 60% by 1985 (following the commissioning of Switzerland's nuclear power plants) and is now around 56%. In Switzerland nowadays, electricity is mainly generated by hydropower (59.9%), nuclear power (33.5%) and conventional thermal power plants (2.3%, non-renewable).
New Zealand has the third-highest renewable primary energy supply after Iceland and Norway. New Zealand was an early adopter of several alternative energy technologies, particularly hydroelectricity and geothermal energy. It has achieved a level of 60% of total electricity generation from such sources. As hydro energy is largely impacted by rainfall, the amount of energy produced may vary from year to year, hence the trending up over time. In recent years, New Zealand’s development of renewables has lagged that of other countries, particularly in wind power. However, the number of wind and geothermal developments began to increase rapidly from mid-2000s forward, mainly due to declining costs of renewable technologies and the downgrading of natural gas reserves. Total solar energy generation still remains a small proportion of total primary renewable energy.

All the charts in this blog series have been published on JMP Public. I encourage you to go have a look!
You access all the posts in this series here.
You must be a registered user to add a comment. If you've already registered, sign in. Otherwise, register and sign in.