JMP Blog
A blog for anyone curious about data visualization, design of experiments, statistics, predictive modeling, and more- JMP User Community
- :
- Blogs
- :
- JMP Blog
- :
- Everything I need to know about data visualization, I learned from Thomas the Ta...
- Subscribe to RSS Feed
- Mark as New
- Mark as Read
- Bookmark
- Subscribe
- Printer Friendly Page
- Report Inappropriate Content
This time, our story begins about five years ago, maybe a little more. My daughter was in her train phase, so she and I would build tracks with the little wooden train sets. Sometimes, we would take over the kitchen floor.
She would have me read Thomas the Tank Engine stories to her at bedtime, and her favorite show was the Thomas & Friends stories from the BBC. Now what does that have to do with JMP? Well, at the time, not a dang thing. I didn’t even work for JMP during that phase. But since I haven’t been traveling (because the world is going bananas), I’ve been going back to my graphic design roots a little and studying data visualization. It’s been a lot of fun.
I’ve been watching video presentations by our own Xan Gregg (@XanGregg), going over my notes from other presentations, reading some Edward Tufte and Stephen Few. I even got to take a couple of classes with Nick Desbarats.
Somewhere in the last few months, something clicked, and I realized that all of these experts in data visualization have been running on the same track (if you pardon the preemptive pun). If you were to boil everything data visualization experts say down to one simple thought, it could come right out of a Thomas the Tank Engine book: All a visualization wants is to be useful.
Flashy trains vs. working trains
In my daughter’s (heavily copyrighted) books, the anthropomorphic trains generally all try to be useful. But they all have their own personalities: Some like to be clean, some don’t mind being a little rough, and some like to be flashy. It takes all kinds, right? But ultimately, the highest praise that could be imparted to the engines by a human is that they were “really useful.” Not that they were pretty, flashy, or rough around the edges, just that they were useful.
If we were to anthropomorphize a graph, it might have a similar feeling. So, how does a graph become useful? Well, it starts with a problem statement, message or finding that the graph is intended to communicate. Let’s look at a few examples, compare them to their stated purposes, and then look at some tweaks to make them more useful.
This graph showed up in my news feed a while back. The stated purpose was to “[show] how activities stack up in terms of coronavirus risk” based on four factors defined in the article.
So, how well did this graph meet the purpose of the visualization exercise? For me, the answer is: “They did OK but could have done a lot better.” We’ll talk about the details of why later, but the core point is that it’s difficult to tell at a glance which activities are risky and to compare risk levels between activities.
In this next example, I’m going to take some of my own medicine and use a visual I created for my 2020 Halloween article. I analyzed the text for Orson Welles’ broadcast of "The War of the Worlds." You can have a look at my analysis here. The purpose of this visualization was to summarize all the terms in the radio script and highlight important themes or terms.
How did I do? I’d say I failed miserably. Why? Well, again we’ll get into the details later, but things like word clouds drift more into the realm of data art. You see word clouds used as logos, marketing materials, T-shirts, etc., because they’re fun or visually striking. As a tool for communicating insights -- even with helpful highlighting -- they’re pretty awful.
Ah, spider plots…my old nemesis. Sorry. I have to admit a certain bias against these. But let me see if I can get you to see why they bug me so much (sorry about the pun). Here’s the caption for a spider chart from a journal article: “The spider diagram of the five sensory attributes for 14 types of beer is shown in [the graph]. Different samples had their individual sensory character, and samples 8, 10, 14, 11, 9 and 2 had the strongest sour, bitter, sweet, goaty, acerbity and ‘other tastes’ individually.” And, here’s the graph:
Yep. Pretty bad. But it’s a fairly common situation in these charts.
One downside of doing the work to learn more about data visualization is that once you’ve seen the problems, you really can’t unsee them. And the problem in our current world is that there are a lot of graphs being produced daily. Between the pandemic and the US elections, we are inundated with graphics. While these visualizations can be flashy and polished or rough around the edges, for the most part, a lot just aren’t useful. So, we have a world of sad, unfulfilled graphs. (That’s a sad thought, isn’t it?) Well, it’s the holiday season, so let’s fix that. First, we need to get to the underlying problem.
Pretty may not be useful, but useful is always pretty
Why are there so many non-useful graphs out there? (I’m not going to call them bad graphs; it’s not their fault that they aren’t useful -- they were just drawn that way). My opinion on this is that it boils down to people missing a single concept: Things can be pretty without being useful, but something that is useful is inherently pretty. And by pretty, I mean that there is an elegance of form that comes from something perfectly meeting its intended purpose.
Nick Desbarats uses the Greek term telos to describe this concept. A lot of us in this business (myself included) can get so hung up on pushing the boundaries of visualization that we forget data visualization is about communication. Once we’re visualizing for the sake of visualization and lose that communication piece, our graphs are in danger of becoming non-useful. Now, that’s not to say that those non-useful graphs aren’t beautiful, just that they aren’t optimal communication tools.
Stick to the easy track
So, what are we to do? I’ve shown you a bunch of graphs that aren’t really as useful as they could be. And because they aren’t as useful as they could be, they are sad graphs. We don’t want sad graphs, do we? No! So let’s fix things.
In those first examples, the issue is that the authors aren’t playing to the strengths of the brain’s visual processing systems. If we were to follow the line of reasoning laid down in Daniel Kahneman's book Thinking, Fast and Slow, we could say we have two systems for processing information: One operates unconsciously and is insanely efficient (System 1); the other is designed for handling complex problems but is more deliberate (System 2). Using this second system is also more energy-intensive, so we run the risk of tiring our viewers if we use that one. So, when people have to think too hard about graphs, they aren’t useful (i.e., sad graphs) and our brain gets tired (sad brain)! To fix this problem, the trick is to use that first, more instinctive processing system.
System 1 is designed for fast pattern recognition, judging linear distances and similar tasks. Think of it this way -- if it were needed thousands of years ago for split-second life-or-death decisions, it’s going to be processed by System 1. That’s why data viz experts harp on the idea that using bar charts is better. We’re better at judging linear distances (straight lines) than curves or areas. We generally process bar charts with System 1. Another way to say this is a person is hardwired to quickly read and process the information in a bar chart. The shortest distance between two points is a straight line, and the fastest path through our brains happens to be one, too!
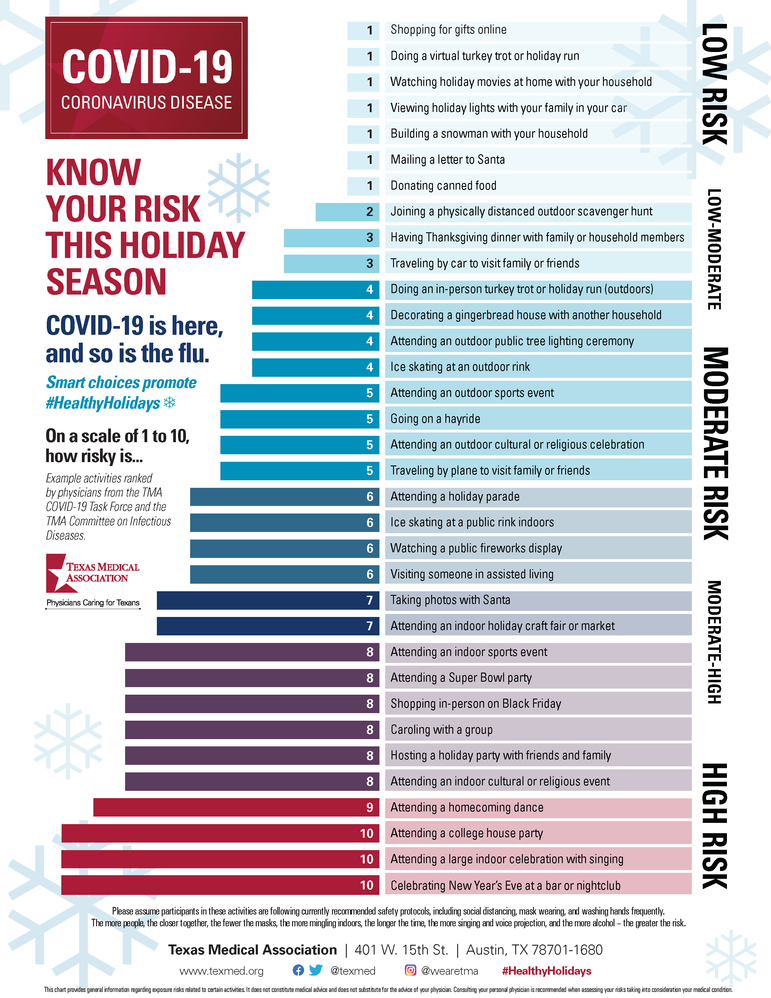
Going back to that first graphic, the root problem is that we are creating a visual that requires us to use System 2. We have to create some arbitrary scaling, quantify each square for an activity against that scaling, and sum up the values for each square. All just to get a total risk score. And then we have to do that again if we want to compare activities. (Just writing that makes me tired!) So, why not do all that in the graph? Here are some alternatives (two that I created in JMP and one from the Texas Medical Association) that are geared toward using System 1:
See how much easier those are to read?
Let function drive form
Let’s think again about the tank engine that started this whole line of thought. Have you ever considered why a locomotive looks the way it does? My grandfather is a big fan of model trains, so I guess my musings on this topic might be genetic. Or they could be a result of the summers I spent as a child looking at his trains or going to a store to collect his latest acquisition. Either way, I’ve always found a certain elegance to the look of a steam locomotive.

Even when they decided to modernize the look, function drove the form:

Similarly, we should always start a graphing exercise with a purpose statement of some kind. Remember, for a graph to be useful, it must have a purpose. If we’re doing exploratory analysis, the statement might even be a question that is driving the investigation.
In the case of the word cloud I used, the goal was to show the most important themes in the script. The word cloud doesn’t do this well. As I said, it’s more “data art” than “data visualization.” Word clouds have a problem with fooling visual perception, since longer words “appear” more important in a word cloud simply by virtue of their length. In the example below I've processed the data a little and changed the visual to a parallel plot. It's better to track each character's or group of characters' association with different topics, providing a more insightful view that is less likely to mislead the viewer. (This is interactive, BTW, so feel free to click around with the Local Data Filter on the left.)
The key point here is that aesthetics are important, but the foundation of a useful visualization is a clear statement of purpose and adherence to that purpose.
Don’t get wrapped around the axle
Probably the easiest way people try to make a graph sexy (yes, I called a graph sexy; get over it) is to take a Cartesian graph (with x,y axes) and wrap it around a central axis. This results in things like pie charts, radar charts, spider charts, etc. And they are sexy...but are they as useful as they could be?
The answer to that question is generally, “no.” Humans aren’t wired to compare distances or sizes in a radial system (pie charts, when used correctly, are an exception to that rule). Things can also get cluttered really quickly. And, unfortunately, a lot of people in the data viz world fall in this trap, including the experts.
Oh! And, rather than going after the spider chart (…again and again), let’s all agree with Xan Gregg that spider charts aren’t particularly useful and look at some different examples of this problem.
The Arctic Death Spiral (yes, it’s enough of a thing to get title case) is a solid example of the problem. The name does evoke drama, and maybe that’s the ultimate persuasive goal of the visual.
The direct goal of the visual is to communicate that sea ice volumes aren’t recovering year over year and, in fact, the situation is getting worse. The problem (with the visual) is that by transforming the data into a radial coordinate system, we’re now working with System 2 cognition, meaning our brains have to work harder to get to the point. So, why not just go for a System 1 solution, like this one?
It’s pretty clear from this graph that: a) there is a downward trend, and b) we’re well below anything we’ve seen in the past 40 years. Further, by using a bar graph we are working with System 1, which means you probably reached those conclusions a lot faster than with the first graph.
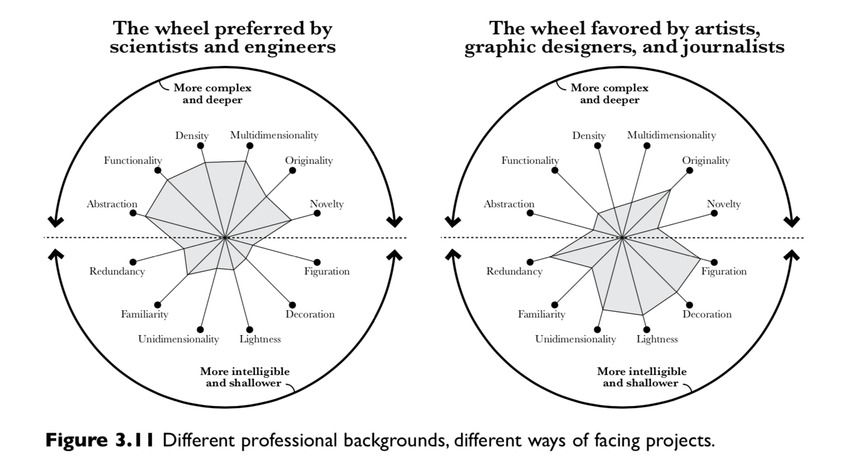
This second graph is one that Alberto Cairo uses to gauge visualizations on six scales. He originally proposed it in his first book Infografia 2.0, and then discussed it again in The Functional Art.
The purpose of the graph is to communicate on the six dimensions how a graphic performs on complexity vs. intelligibility. In the context of our first example, it’s scoring a graph on (conceptually) how much it uses System 1 vs. System 2. Those dimensions are laid out as pairs of design concepts (Abstraction vs. Figuration, Functionality vs. Decoration, Density vs. Lightness, Unidimensionality vs. Multidimensionality, Originality vs. Familiarity, and Novelty vs. Redundancy). But, by fanning these dimensions around a central axis, the reader has to scan across the graph to see the score of each side of the pair. (Also connecting the scores results in something that looks uncannily like a spider plot, but we’ll let that point pass.) Why not just do something like this?
The same information is communicated, and it relies on that speedy System 1 cognition to communicate it! So, you get the information faster.
I guess the point I’m trying to make here is that, unless there’s a really good reason, avoiding radial plots is probably a better course for graphs that are really useful.
Always be truthful
This can be a touchy subject, and I’m not about to accuse anyone of purposely misleading others. The problem with truthfulness in analytics comes when we let our personal biases creep into the products of our labors. Data analysis and data visualization have an element of subjectivity built into the science. There is an element of opinion, or at least data interpretation, present in any visual you create. I’ve heard it said (a couple of times by Xan at Discovery Summit and JMP On Air) that all charts are biased, and some are useful (kind of a riff on the famous George Box quote). The important point in making a truthful visual is that the choices we make during its construction and data interpretation process are both transparent. It can be as simple as putting the important point in the graph title:
Or providing a helpful annotation:
The important point is that our graphs need to own their assumptions and conclusions and not try to hide them.
Wrapping things up
There are a lot of things I haven’t covered in this article. Truthfully, in the context of the point I’m trying to make, those things are all simply different strategies for creating useful graphs. If we stick to the goal of making really useful graphs, the rest will naturally follow.
Radial graphs aren’t generally as useful as their linear counterparts; our brains just aren’t wired that way. Failure to call out your assumptions and interpretations makes the graph less useful because your readers don’t understand your thought processes or unconscious biases. Most importantly, the lack of a problem statement or thesis for your visual will invariably make it harder to make a useful graph.
So ultimately, let’s all remember, a useful graph is a happy graph. And we should all do our best to make our graphs as useful and happy as possible. And may all your graphs (and your holidays) be happy. Now, the snow is starting to fall up here in ‘Toga Springs, so I’m off for some more cocoa and contemplation. See y’all in 2021.
- © 2026 JMP Statistical Discovery LLC. All Rights Reserved.
- Terms of Use
- Privacy Statement
- Contact Us


You must be a registered user to add a comment. If you've already registered, sign in. Otherwise, register and sign in.