JMP Blog
A blog for anyone curious about data visualization, design of experiments, statistics, predictive modeling, and more- JMP User Community
- :
- Blogs
- :
- JMP Blog
- :
- For your Halloween reading pleasure, I will now analyze a Martian invasion in JM...
- Subscribe to RSS Feed
- Mark as New
- Mark as Read
- Bookmark
- Subscribe
- Printer Friendly Page
- Report Inappropriate Content

For me, the broadcast holds a special place in my Halloween traditions. As a boy, I missed trick-or-treating one year because our family moved into our first house on Halloween. My local radio station was one of those that rebroadcast the production. I don’t know if they still do or not. But I remember sitting on my bed in my new room that night and listening to that masterful example of radio drama. Ever since, I’ve tried to continue the tradition of listening to the broadcast (it’s in the public domain, and you can listen to it here: The War of the Worlds) on Halloween.
As a funny side note, the 1968 remake, produced in Rochester, NY, (seriously, what is it about people up here in NY?) actually did cause a small panic. The radio station tried to mitigate any potential panic by broadcasting a disclaimer. The station even increased the frequency of disclaimers after panicked calls started pouring in! But the damage was already done. It even resulted in a newspaper reporting that the invasion had actually happened.
Anyway, I had a thought a few weeks back: Why not analyze the recording of the original using Text Explorer? It was, admittedly, a fairly random thought. My idea was to explore the data and see if I could tease out the different plot points and themes in the story. It turns out there’s a transcript that breaks down lines by actor. A little bit of import work and fine-tuning later, I was ready to go! Let’s have a look at what I found.
Analyzing ‘The War of the Worlds’
Probably the easiest thing to do is to start with word clouds. Strictly speaking word clouds aren’t the greatest way to visualize text information. They tend to distort the significance of terms, for instance. But we’re just goofing around in JMP, so why not!
Due to the writing style, the names of the people speaking or being spoken to (it starts off as a news broadcast, remember) are highly represented in the data set. In this first word cloud, we can see that Prof. Pierson, the narrator and main character (we can’t really call him a protagonist) is highly represented, and that’s about it. This is because I haven’t done anything with stop words, though at this point, I have added phrases (Grovers Mill, for instance) to the terms list.
With some tinkering in JMP (I provide a procedure at the end of this article about how I did the coloring), we can start to peel back some of the layers and get some additional information (below). We can now see that Prof. Pierson is associated with Princeton University. He’s also associated with the observatory there, where he works as an astronomer. These associations come from the CBS field reporter, Carl Phillips, telling us frequently who Prof. Pierson is early in the story. We can also see he pops up at Grovers Mill, NJ, (the first Martian crash site) and some other places around New York City. All in all, a pretty clear picture of the good professor’s travels during the events of the broadcast.
Let’s do a couple more. I put Prof. Pierson as a stop word from this point on to make the other themes in the cloud a little easier to see. Next, let’s go to Carl Phillips, the doomed field reporter for CBS.
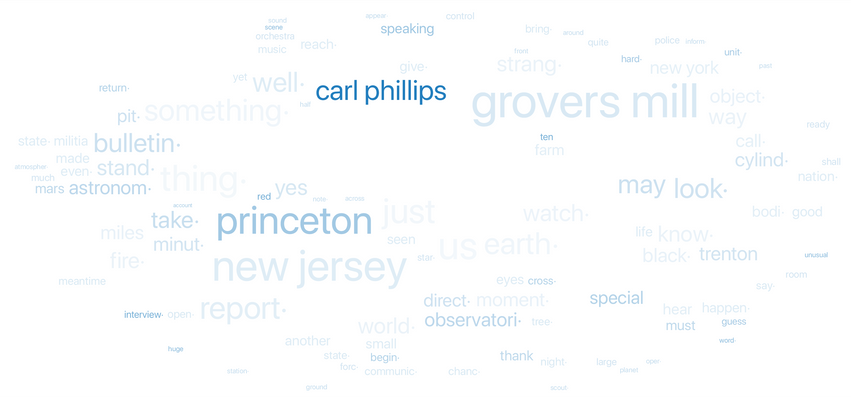
His part of the story is primarily around Grovers Mill, but he interviews Prof. Pierson (the Princeton and astronomy references). All of his lines were delivered via special bulletins as part of the normal CBS broadcast. It’s a little hidden, but you can also see how he died – by the black smoke used by the Martians to protect their landing site.
If we look at “cylinder,” we can see that they contained the Martians' iconic invasion machines, the first of which landed in NJ.
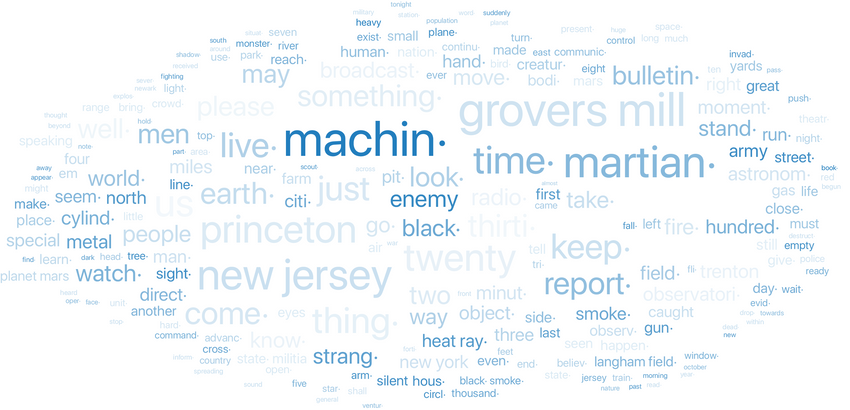
Let’s look at the machines themselves next. The first thing I noticed was that they show up with a lot of other things. This makes sense since the machines are a major plot device (almost a character) in the narrative. You can see that they came from cylinders. They had heat rays (bottom center). There’s also some indication that they were attacked by the Army, which triggered the first use of the black smoke to attack the soldiers.
I could go on, there’s lots of fun to be had looking at what terms show up together in the word cloud. Since the script is in the public domain, I’ve posted my data set with this article. If you want to play, just run the word cloud script and then right-click on the term in the word cloud you want to explore. From the menu, click Select Text and the terms will be highlighted in the word cloud.
Topic Analysis in JMP Pro
All right, let’s get the big guns out. Topic Analysis in JMP Pro can make people a little nervous, but it’s super useful. For this analysis, I put all the character names back in (I took them out using stop words for the word cloud stuff). Now, Topic Analysis takes the terms in the term list and looks at how often each term shows up in each row of the data set (it's called the Document Term Matrix, in case you were wondering), taking into account how often the term shows up in the document as a whole (this is called the TF/IDF ratio in text analysis). It performs some multivariate transformations on it to produce a collection of terms that tend to show up together. The group that explains the most information is called Topic 1. The collection that does the next best is Topic 2, and so on, meaning that “topic” is a bit of a misnomer in this case. But the information provided (whatever you want to call it) is still really useful. Let’s have a look at the first three topics. So that I don’t inundate you with numbers, I’m going to use the word clouds that JMP generated for each topic here. Note that the sizes for each term are based on the Topic Loading in these word clouds, not how often they appear in the data set! Big difference.
Topic 1 has the big stuff you would expect: Prof. Pierson, the Martians and their war machines, the black smoke and the global nature of the attack (which isn't something we got out of the word cloud).
Topic 2 is a summary of terms associated with the Army’s attempts to defend against the cylinders. You see the heat ray and references to the bulletins from the Army about its defensive efforts.
Topic 3 is just Prof. Pierson and Carl Phillips talking, primarily from an interview early on in the broadcast from the professor’s observatory.
Topic 4 is about the first landing site. You can see terms describing the crater, who was there, etc.
Topic 5 contains the last official broadcast from CBS warning people that the Martian machines were moving from NJ to New York City. This is also the moment that the Army was attacked by the Martian heat ray.
Now, let’s circle back to something more numerical. I can score each line of the script based on how closely it aligns to each of the topics. Note that the scales here are a little odd, but we’re just interested in relative magnitudes. By putting the document scores for each line of the script and who said them, I can build up a parallel plot in Graph Builder. I uploaded this one to JMP Public so you can play with the Local Data Filter.
Looking at some of our main characters, Prof. Pierson generally stays in the main pack with everyone else, but has occasional lines that score highly on Topics 1 and 3. The announcers (there are actually three) score quite highly on Topics 3 and 5. In both cases (Prof. Pierson and the announcers), this makes sense as the announcers would be interrupting the broadcast to say that they were switching to Prof. Pierson and Carl Phillips for updates, which also explains why Phillips’ lines tend to trend with those of the announcers. Anyway, play around with it and see what else you can tease out!
Wrapping things up
And that’s about it. A fun little analysis for Halloween. Nothing earth-shattering, but still some fun goofing around with text analysis in JMP and JMP Pro. And so, to borrow from the master himself:
This is Mike Anderson, ladies and gentlemen, out of character to assure you that this analysis of "The War of the Worlds" has no further significance than as the holiday offering it was intended to be. The JMP Blog’s own version of dressing up and jumping out of a bush and saying, "Boo!"
Starting now, we couldn’t soap all your windows and steal all your garden gates by tomorrow night, so we did the best next thing. We analyzed the night Orson Welles annihilated the world before your very ears and utterly destroyed the CBS.
You will be relieved, I hope, to learn that we didn’t mean it, and that both institutions are still open for business.
So, goodbye everybody, and remember the terrible lesson you learned tonight. That grinning, glowing, globular invader of your living room is an inhabitant of the pumpkin patch, and if your doorbell rings and nobody’s there, that was no Martian; it’s Halloween.
Have a safe and happy Halloween!
Afterthoughts on the Word Cloud Coloring
When I was circulating this article before publication, some people asked how I did the coloring of the word clouds. I thought I’d take a second to share a video to show you the steps on how that was done. It’s pretty simple. You just need to use the selected()command in a column in the data table. Here’s how I did it (with a video at the end to show the steps):
- Starting from the data table that has the text, create a new column.
- Create a formula in that new column with “Selected()” as the formula. You need to type it in as it’s not one of the standard formulas in the Formula Editor catalog.
- Click OK in Formula Editor.
- Create a Text Explorer (Analyze > Text Explorer) and set it up with your text. (A tutorial on Text Explorer can be found here.)
- Turn on the Word Cloud (Red Triangle Menu > Display Options > Show Word Cloud).
- Select a term in the word cloud that you would like to use for highlighting (right- click on the term > Select Rows).
- Under the Word Cloud Red Triangle Menu, select Coloring > By Column Values… and select the column you created in Step 1.
- Adjust the gradient for the word cloud to your liking.
- © 2026 JMP Statistical Discovery LLC. All Rights Reserved.
- Terms of Use
- Privacy Statement
- Contact Us


You must be a registered user to add a comment. If you've already registered, sign in. Otherwise, register and sign in.