Recently, I was on a trip to the store one of the items on my list was apples. When I got to the apple aisle in the produce section, I felt overwhelmed by the many apple varieties. This is a long way from the days of red delicious, Granny Smith or golden delicious of my childhood. The store had more than 20 varieties of apples, and it made me wonder which one is the tastiest. When I got home, I discussed this with my wife, Kelly.
Me: “There are over 20 varieties of apples at the store. How do we know we are choosing the best-tasting?"
Kelly: “That is a lot. Did you pick up three like I asked?”
Me: “How could I pick just three when there are so many to try?”
Kelly: “How many apples did you get?”
Me: “Sixteen, two of eight different varieties.”
Kelly: “What are we going to do with 16 apples?”
Me: “Apple Taste-Off 2018! Good thing the family is in town for the holiday. They can help judge.”
Kelly (with a hint of sarcasm): “Oh, joy.”
I decided to set up a MaxDiff study in JMP to run this experiment. The eight apples for the study are Ambrosia, Honey Crisp, McIntosh, Pink Lady, Gala, Fuji, Snap Dragon, and Opal. The testers for this study are all nine people who attended our Thanksgiving celebration: my kids, my wife, my sister, my parents, my wife’s parents and myself.
I explained how the study works to everyone: “Each person will try three apples and pick their favorite and least favorite of the three.”
My daughter, Payton, responded, “I don’t like apples.”
Kelly said, “That seems like a lot of apples to try.”
My sister, Beth, asked, “Where is the wine?”
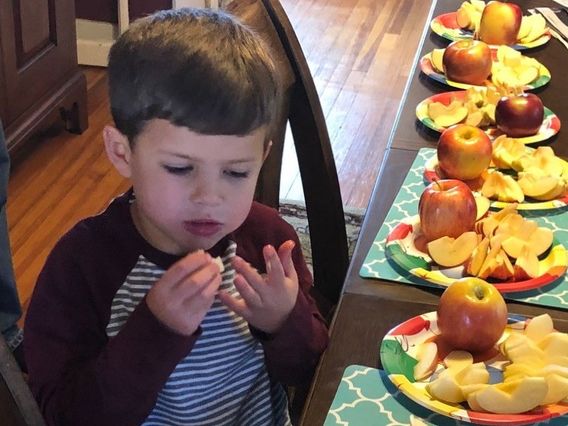
The enthusiasm for Apple Taste-Off 2018 was palpable. I cut up all the apples and labeled them one through eight to hide the identity of the variety to remove some of the bias. Because he's 5 years old and an apple lover, my son Sam was the most willing tester and started the apple tasting.
 My son, Sam, enthusiastically kicked off Apple Taste-Off 2018.Sam liked all the apples, but he made his picks. Each tester tried four choice sets of three apples each, (maybe Kelly was right about a lot of apples) and made their picks. For a MaxDiff study, the favorite apple gets a response of 1 and the least favorite apple gets a response of -1 leaving the one in the middle to have a response of 0. Here is an example of how the responses were entered.

As the study went on, it was clear there was a diverse set of tastes, and it did not appear to be a clear favorite. There did seem to be a consensus on least favorite apple of the group. When my mother-in-law, Lisa, tasted the apples, here is how it went:
Me: “OK, try apple number 3 again.”
Lisa: “Ugh, that is the one that I fed to the dog.”
Me: “Can you try it again?”
Lisa: “I can just remember that it is my least favorite.”
After compiling the results into JMP, I ran a MaxDiff Model. The results are below.

For those who are not familiar with the results of a MaxDiff Study, the Marginal Utility is an indicator of perceived value. The higher the marginal utility, the greater the value of that apple flavor. In this case, Ambrosia, Honey Crisp and Pink Lady were the highest-rated apples.Also, you might guess which apple my mother-in-law did not want to eat twice. The Marginal Probability is the estimated probability that a subject would pick that apple flavor over all the other flavors. The likelihood ratio tests show that the variety of apples is having an impact on the testers. If the variety did not affect how people voted, the Prob>ChiSq (or p-value) would be larger. All right, now let’s compare apples to apples.

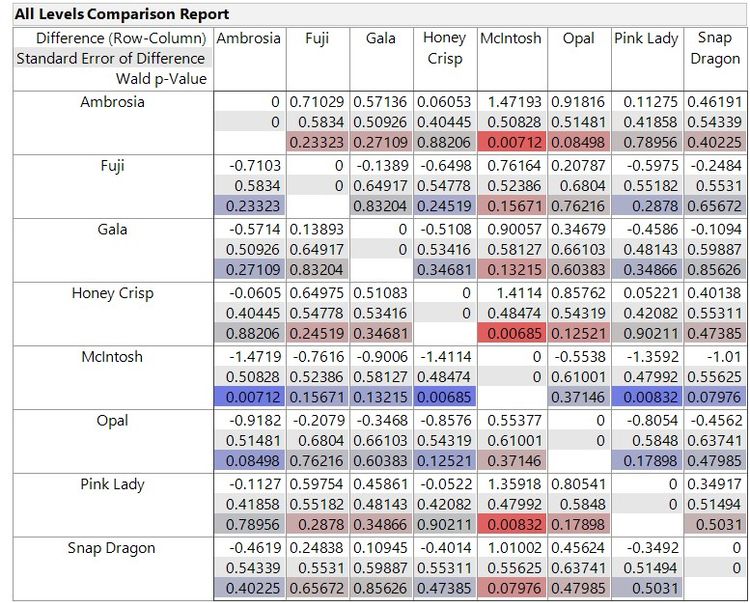
To read this report, select your apple of interest in the row and then compare it to the apple in the column. For example, if we look at the box comparing Ambrosia (row) to McIntosh (column), the top number shows us the difference in Marginal Utility between the two apples, in this case ~1.47. The middle number is the standard error of that difference ~0.508. The bottom number highlighted in red is the probability that difference would occur by chance or p-value 0.00712. The small p-values indicate the strong statistical significance and are shaded the darker shades to indicate that the apple is more statistically different. Red shade is associated with an increase in marginal utility, and blue is a decrease.
The conclusion is the family did not find a clear favorite apple variety, but we did find an apple variety that we should skip for the next family gathering.
NOTE: Data for my apple comparison test is attached (see below) for you to try.