- Browse apps to extend the software in the new JMP Marketplace
- This add-in is now available on the Marketplace. Please find updated versions on its app page
- Subscribe to RSS Feed
- Mark as New
- Mark as Read
- Bookmark
- Subscribe
- Printer Friendly Page
- Report Inappropriate Content
JMP Add-Ins
Download and share JMP add-ins- JMP User Community
- :
- File Exchange
- :
- JMP Add-Ins
- :
- Capability Explorer
Purpose
The Capability Explorer add-in provides an interactive, six-graph summary for evaluating process capability. The report provides a process capability analysis and allows users to explore the results and quickly track down outliers or further investigate their data.
The add-in also provides several quick-launch buttons that bring their data into different analysis platforms or export the results to presentation files or interactive HTML.
Updates
Sept 17, 2024 - The Capability Explorer add-in has been updated and an overview video is now available. The updates are summarized in new post. Installing the new version will overwrite the prior version.
User Guide
Launch the add-in
After launching the add-in, specify the column containing the process variable of interest (currently the Capability Explorer handles a single continuous process variable). Select an optional subgroup column or subgroup size and click OK. If a subgroup size is specified, a new subgroup column will be created.
The add-in creates a grid of six interactive graphs that are commonly used to determine process capability.
- Control charts (I/MR or XBar/R) provide information on the process stability
- Recent Observations or Recent Subgroups show the most recent data
- The Histogram, Probability plot, and Goodness-of-fit outputs provide indications on whether the data is normally distributed
- Capability Indices and Box Plots provide capability indices, defect rates, and standardized box plots
Selecting data points in the control charts, histogram, probability plot, or box plots will highlight the same data points in each of the other graphs and the data table. This interactivity makes it easy to identify possible outliers and other data points of interest.
Use the Red Triangle options to:
Modify Graphs
These check-boxes toggle different features in the graphs to help the user update the look of the graphs. Some options are not available when a subgroup is specified.
Additional Analysis
These quick-launch buttons provide a way to further explore the data in different JMP platforms. When launched, each platform generates a new tab in the report window.
- Capability launches the Process Capability platform and provides additional statistical information.
- Control Chart launches a stream-lined Control Chart Builder platform to further analyze the process data.
- Fit Distribution launches the Distribution: Compare Distributions platform to help identify an alternative distribution when the goodness-of-fit tests indicate that a normal distribution is not appropriate.
Export
- Copy to Clipboard copies the current tab to the clipboard to paste it into other files (Word, PowerPoint, etc.).
- Interactive HTML button generates an interactive HTML file that can be shared with non-JMP users to explore and interact with the data. The Interactive HTML file will contain all the tabs in the Report, but many of the graphical toggles are disabled.
Save the Script to the Data Table
- Save the script to the data table.
Notes
The add-in has been tested on Windows and Mac, JMP 17 and 18
Big thanks to @nick_shelton, @MikeD_Anderson @MarilynWheatley for helpful discussions.
Updates
Sept 8, 2023 - A minor update to enable the Capability Explorer work in all languages.
Sept 16, 2024 - Version 2.0 - several updates (see below)
This looks great and seems very smooth! I do have 2 suggestions:
- Options to use S rather than R charts.
- Ability to use 3-way charts (some call them between-within charts). A snippet of Minitab's similar view can be found here - Example of Between/Within Capability Sixpack - Minitab.
@jszarka - Thanks for the comment and suggestions. I am considering an update for the add-in and will keep these in mind.
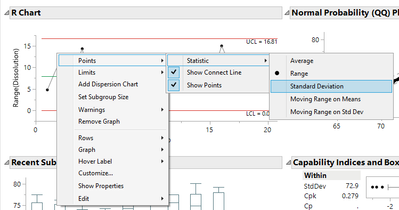
In the meantime, you can toggle the S and R charts by right clicking in the R chart. These charts were built in Control Chart Builder and so you can still access the right click menu. If you change the points to standard deviation for the S chart, remember to also change the Limits.
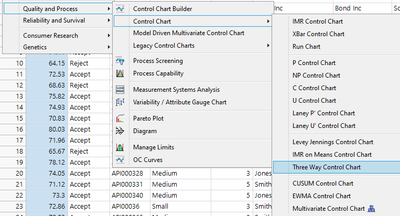
As for three-way charts, you can create these in the Control Chart menu.
I will certainly keep these suggestions in mind for an updated version. Thanks again for the comments!
Hi @Neo
I'm sorry to hear this add-in does not work on version 16. I wrote the add-in using version 17 and have confirmed that it also works in version 18. At this time, I do not plan to make a version that works with older versions.
Have you considered upgrading to a more recent version? The upgrade is free with your subscription and each version has new features!
Hi, @scott_allen
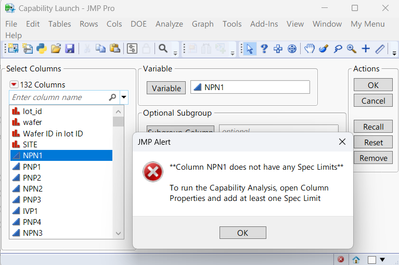
I attempted to utilize this fantastic add-in within JMP 18, but encountered a failure as described below.
The dataset mentioned above is JMP's sample dataset titled "Semiconductor Capability," and naturally, the processes have specified limits.
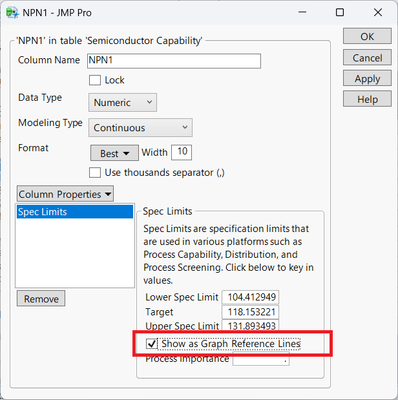
Consequently, I endeavored to modify the "column info" and enabled the "Show as Graph Reference Lines" option, which yielded successful results.
Would you kindly verify and update this add-in accordingly?
Many thanks in advance!
Hi @DaeYun_Kim -
I am glad to hear that you find the add-in useful and I am sorry that you are having some trouble with it.
I ran the same analysis (column NPN1 from the Semiconductor Capability data set) in JMP Pro 18 and I am not receiving this error. I have also tried changing the column properties a few different ways and I cannot reproduce this error.
Does this error happen with other data sets? or columns in the data table?
It is also odd that when you toggle the Graph Reference Lines the add-in works. This should not effect the script, so there are a few mysteries here!
Let me know if you get the error with different data tables and columns and maybe we can figure out what is going on.
Thank you for confirming. I've successfully replicated that there's no error using the JMP sample data table in version 18. Upon further investigation, I discovered that the error occurred with a manually constructed data table.
Once again, thank you for confirming and for creating this fantastic add-in. As a matter of fact, I presented this add-in to nearly 20 engineers at a semiconductor manufacturing company, and I believe it will prove to be immensely beneficial for them.
Hi @scott_allen,
Thanks for the Add-In. I am trialing it and have a few questions. I am running JMP 17.2.0.
First, when I ran my own data I got an error. I re-ran with the Semiconductor Capability sample data and got the same error. See screenshot below. Any idea why I am getting this error?
Secondly, I am missing the "sixth" plot in the bottom right (Capability and Box Plot Indices). I can pull them up from the Process Capability red triangle menu, but it doesn't look as clean. Would you know how I can get them to appear?
Thirdly, the formatting and appearance is different. In the screenshot in the Purpose section of this add-in, the gray horizontal bars are limited to just the title of the graph, while I have the titles of report, variable, platform, etc. Can I adjust this to appear cleaner as (perhaps somewhere in preferences)? In some ways, I am interested in achieving the default appearance, so that another JMP user can run the same data and produce and identical graphs. Would you know how to get a clean, default view?
Thanks for the help!
Hi @kgorski687
I built the add-in using version 17.2 so I am not quite sure why this would not work for you.
Thanks for sending the screen-shots. For some reason, the add-in is not providing the results of the Anderson Darling goodness of fit test, so when it tries to pull the value from the report, it is failing.
To troubleshoot, can you just run this script using the Semiconductor Capability data set and provide a screenshot of the report window?
Distribution(
	Continuous Distribution(
		column( :NPN1 ),
		Quantiles( 0 ),
		Summary Statistics( 0 ),
		Histogram( 0 ),
		Vertical( 0 ),
		Outlier Box Plot( 0 ),
		Fit Normal(
			QQ Plot( 1 ),
			Goodness of fit ( 1 )
		),
		Process Capability( 0 )
	),
	SendToReport(
		Dispatch(
			{},
			"2",
			ScaleBox,
			{Label Row( {Inside Ticks( 0 ), Show Major Labels( 1 )} )}
		),
		Dispatch(
			{},
			"FitDistributions",
			FrameBox,
			{
				Left( 1 ), Right( 0 ), Top( 0 ), Bottom( 1 ),
				Frame Size( 300, 160),
				DispatchSeg( line seg( 1 ), {Line Color( "Plain Gray" )} ),
				DispatchSeg( line seg( 2 ), {Line Color( "Plain Gray" )} )
			}
		)
	)
)
Also, are you running any special preferences?
Hopefully we can figure this out,
-Scott
Hi @scott_allen,
It is most certainly the preferences that I had on the Distribution Platform. In the screenshot below, I have on the left my original preferences (for a Normal Quantile Plot, Fit Normal, and Horizontal Layout) while running the script you shared, and on the right the script run with the Distribution Platform preferences reset to default. When reset to default, the Capability Explorer functions works without any obvious problems.
Now that it is working, I would like to be able to save the JMP report to the data table as a script, but after doing a brief search in the JMP Community, I came across this post trying to add a Save Script red triangle menu to an outline box (https://community.jmp.com/t5/Discussions/JSL-How-to-add-the-red-hot-button-options-to-an-Outline-Box... that but there doesn't appear to be an effective solution.
So, if I wanted to save the Capability Explorer reports for my dozen or so variables, I would have to save the report within my Windows file explorer, and re-run the Add-In whenever I update my data, and re-save the JMP report? Do you have any other recommendations for saving the report to easily re-run when additional data is added (with my specific customizations for limits, points, Warnings), or if this data table is shared with another user that doesn't have the Add-In?
Cheers,
Krystians
I'm glad to hear that adjusting the preferences fixed the functionality. I will take a look at this and see if there is a way to make the add-in less sensitive to preferences.
Once you upgrade to version 18, you can set up Platform Presets to customize the desired layout. This way you can get customized views without changing the Preferences.
Right now, you cannot save these reports as JMP scripts, so you will need to re-run the analysis if the data changes. This is something I have in mind for a future update (hopefully later this year!). I would like to update this add-in so you can run multiple variables at once as well as save the report as a script to the data table.
For now, if you would like to share these reports, you can save them as images or save them as Interactive HTML files using the buttons on the left:
The Capability Explorer add-in has been updated.
New in Version 2.0
- All add-in options are now in the Red Triangle
- New Red Triangle options
- Launch Data Filter - quick access to the Data Filter found on the data table toolbar
- Save Script to Data Table - saves a script that remembers many of the add-in customizations and then relaunches the add-in.
- Toggle between R and S control charts
- Scan Recent Subgroups with the same slider bar as in the recent observation graph
- Toggle boxplots and/or individual points in the Recent Subgroup graph
- Toggle between PPM and % units in the non-conformance report in the Out-of-Spec summary tab
- Various bug fixes and performance improvements
Recommended Articles
- © 2026 JMP Statistical Discovery LLC. All Rights Reserved.
- Terms of Use
- Privacy Statement
- Contact Us


