- Subscribe to RSS Feed
- Mark as New
- Mark as Read
- Bookmark
- Subscribe
- Printer Friendly Page
- Report Inappropriate Content
JMP Add-Ins
Download and share JMP add-ins- JMP User Community
- :
- File Exchange
- :
- JMP Add-Ins
- :
- Analyse Columns
- Description
- User Interface
- Summary Statistics - Discrete (Nominal/Ordinal)
- Summary Statistics - Continuous
- Action Buttons
- Inspiration
- Example of exploratory analysis with analyse columns using Probe.jmp
- Possible future work
Description
Analyse columns is a tool which will perform fairly quick pre-determined summary statistics (explained below) for your discrete (nominal/ordinal) and continuous data. It also allows you to perform some quick launch tasks directly from the Analyse Column's window such as delete columns, create scatterplot matrix and add largest nines to missing value codes.
This add-in uses Summary table to calculate most of discrete summary statistics and Distribution platform to calculate continuous summary statistics. These were chosen for their ease of use while scripting and speed.
Examples below are from using Analyse Columns on all columns of JMP's sample data table Probe.
User Interface
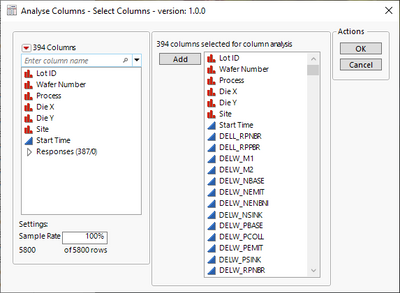
Launch window which allows user to select columns and sampling rate.
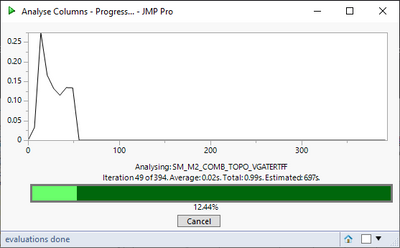
Progress bar with functional Cancel button
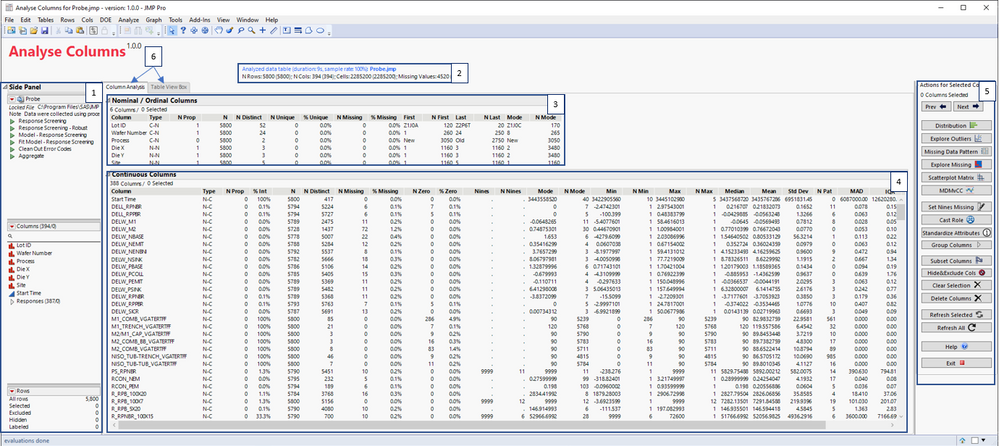
Main window with Side Panel open.
UI Main window explanation:
1. Same side panel that can be seen in data tables, this can be closed from the triangle on top left corner.
2. Short information about the analyzed data table (rows, column, analyze duration). Clicking on the table name will bring it to front
3. Summary statistics table for Nominal / Ordinal columns
4. Summary statistics for Continuous columns. This also has horizontal scroll bars so remember to scroll to left and right
5. Action buttons
6. Tab pages to change between analysis window and view of the original data table.
Summary Statistics - Discrete (Nominal/Ordinal)
See Using JMP > Summarize Your Data > Explanation of Summary Statistics for most of the summary statistics.
- Column - Name of the analysed column
- Type - Type of the column. First character indicates data type (C - Character, N - Numeric) and second modeling type (N - Nominal, O - Ordinal)
- N Prop - Count of column properties
- N - Count of non-missing values
- N Distinct - Count of distinct values (N categories)
- N Unique - Count of values which have only one value
- % Unique - Percentage of columns which are unique
- N Missing - Count of missing values
- % Missing - Percentage of missing values
- First - First value in alphanumeric order
- N First - Count of first values
- Last - Last value in alphanumeric order
- N Last - Count of last values
- Mode - Most common value
- N Mode - Count of most common values
Summary Statistics - Continuous
See Basic Analysis > Distributions > The Distribution Report > The Summary Statistics Report for more detailed explanation of most of the statistics.
- Column - Name of the analysed column
- Type - Type of the column. First character indicates data type (N - Numeric) and second modeling type (C - Continuous)
- N Prop - Count of column properties
- % Int - Percentage of integer values
- N - Count of non-missing values
- N Distinct - Count of distinct values (N categories)
- N Missing - Count of missing values
- % Missing - Percentage of missing values
- N Zero - Count of zero (0) values
- % Zero - Percentage of zero values
- Nines - Numeric value of highest nines
- N Nines - Count of highest nines
- Mode - Most common value
- N Mode - Count of most common value
- Min - Minimum value
- N Min - Count of minimum values
- Max - Maximum value
- N Max - Count of maximum values
- Median - Median value
- Mean - Mean value
- Std Dev - Standard deviation
- N Pat - Count of robust outliers. Calculated as 6sigma outliers using median as mean and IQR/1.35 as sigma (AEC - Q001 Rev-D)
- MAD - Median Absolute Deviation
- IQR - Interquartile range
- Kurtosis - Measures peakedness or heaviness of tails.
- Skewness - Measures sidedness or symmetry.
- Nonparam Skew - Non-parametric skewness. (Mean - Median) / Std Dev. More info Nonparemetric Skew (wikipedia)
- Autocorrelation - First Order autocorrelation that tests if the residuals are correlated across the rows.
- Best Fit - By default this is empty. When Best Fit button is pressed, this will show the best fit of data from Normal, Normal 2 Mixture, Gamma, Weibull and Exponential distributions.
Action Buttons
Actions are performed mostly on selected columns. If platform is launched, it will be pre-filled with selected columns.
|

|
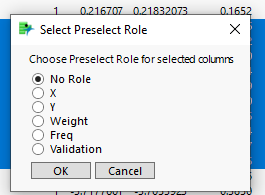
When Cast Role is pressed following window will open:
Inspiration
This add-in was inspired by the need to quickly get overview of new large data sets (Pandas Profiling is one such existing library).
Example of exploratory analysis with analyse columns using Probe.jmp
Run Analyse columns for all columns.
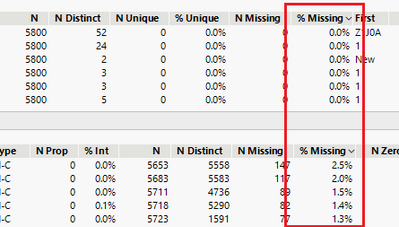
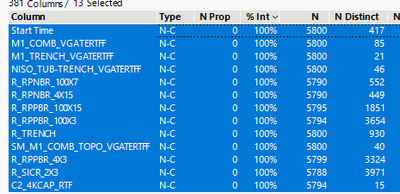
Quickly check if there column which have most values missing
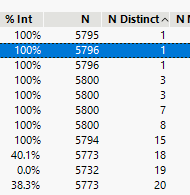
or if values are mostly the same (you can re-order by clicking on header)
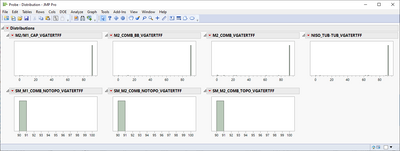
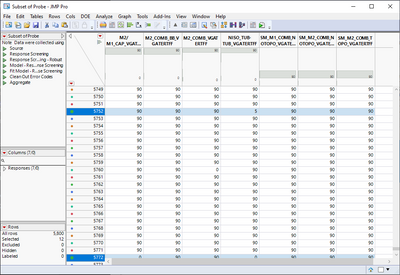
Select some of the columns which have most of the values same and use distribution and subset to check what they look like
As values are mostly same, they might not be that useful in further analysis. For demo purposes, we will use Hide&Exclude to remove these from analysis.
Next quick check could be to see, if there are some Continuous columns which should be possibly recoded as Nominal or Ordinal. Again Distribution and Subsets are good quick tools for this (looking for example for version numbers, id numbers and such). These values don't seem to be such values
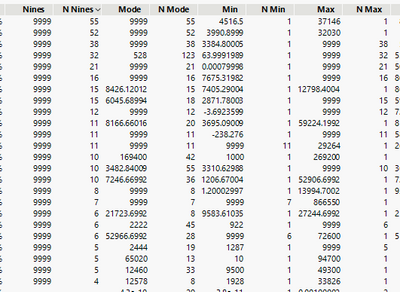
Next we will check if there are possibly nines used instead of missing values and these seems to be quite a few columns like that
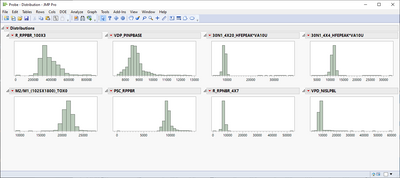
Analyse Columns will look for highest absolute nines and use those as Nines, it won't drop then based on quantiles or such. Some of those seem to have quite interesting situation where there are values larger than Nines. Again, we use distribution and subset to explore them in more detail
Distributions seem quite quite fine:
Next we create subset with those columns and take a closer look. These 9999 rows and missing values seem quite suspicion to me.
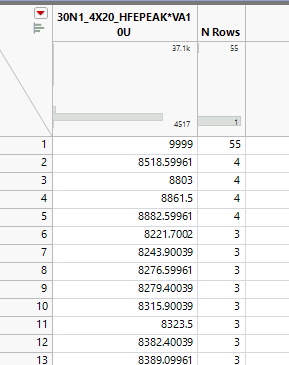
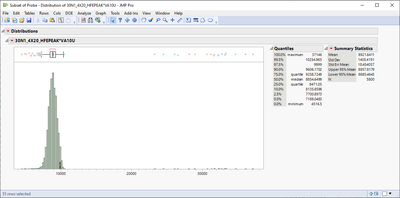
For example column 30N1_4X20_HFEPEAK*VA10U has 55 9999 values, doesn't feel completely normal to me. Let's create summary table of that column and order by N Rows.
This would require more knowledge of the process, but if I had to make a guess these are failed measurements / missing values, even though they are not even close to the largest values in the column
For demo purposes we conclude that those are missing values and use Set Nines Missing to exclude them WITHOUT losing data. After we have used Set Nines Missing, we should use Refresh Selected to refresh summary statistics calculations for those columns
Before:
After:
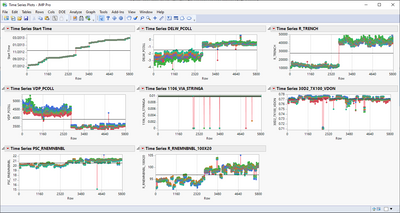
Next we could take a look at first order autocorrelation to see if the data isn't random and has some "row based" dependencies. There are quite a few columns with high autocorrelation, Start Time being obvious. We select some of the high autocorrelation columns and use Time Series to see what is going on
Seems like that there could be some dependencies which is caused by time.
There are still quite a few checks we could do, such as looking for correlations (we should clean outliers first for example with explore outliers) or use Model Driven Multivariate Control Charts to look for interesting patterns but I think we have enough to demonstrate what can be done with Analyse columns for now.
Possible future work
- Add function to create report similar to Pandas Profiling
- Allow user to choose which summary statistics to calculate
- Allow user to choose which summary statistics to show and save these settings
- Improve speed of calculations
- Allow calculation of capability statistics if continuous column has specification limits
- Save calculated statistics to data table as table variable / table script, to allow quick re-run of the tool. Multiple of these should be saved, so user can keep "change" log of summary statistics and/or demonstrate effect of sampling on summary statistics
- Add some sort of an option to "tag" columns with notes. This will require most likely some sort of new window to write the notes and to retrieve then as custom column property is best for this (Notes would be best, but user cannot see if those have been set to column).
Change Log
24.12.2022 - Removed company logo from UI
Just noticed there is a bug with Continuous Table Box and the values are being shifted by one when using JMP17. Most likely the platforms I'm using for summary statistics have changed from JMP16 -> JMP17. When I have time I'll take a look and try to fix the issue.
Recommended Articles
- © 2026 JMP Statistical Discovery LLC. All Rights Reserved.
- Terms of Use
- Privacy Statement
- Contact Us
