- Discovery Summit 2026: Early User Edition - September 23-24.Register. It's free.
- Graph Builder Toolbar streamlines interactive graphing. Creates shortcuts on Report and GraphBuilder Helpers toolbars. Download and install the extension.
- Subscribe to RSS Feed
- Mark Topic as New
- Mark Topic as Read
- Float this Topic for Current User
- Bookmark
- Subscribe
- Mute
- Printer Friendly Page
Discussions
Solve problems, and share tips and tricks with other JMP users.- User Community
- :
- Discussions
- :
- Re: uneven intervals on the axis


- Mark as New
- Bookmark
- Subscribe
- Mute
- Subscribe to RSS Feed
- Get Direct Link
- Report Inappropriate Content
uneven intervals on the axis
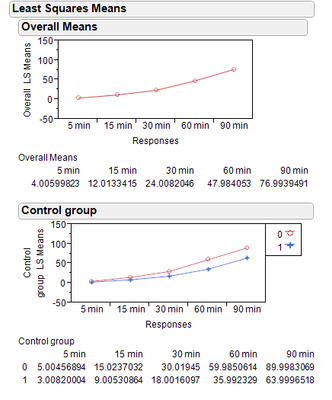
i have a data set of repeated measures yet the time interval between them is uneven (i.e. 5 min, 15 min, 30min, 60min from impact). when using the MANOVA platform the x axis doesn't allow any modifications. Thought of using the graph builder or the chart platform yet they do not allow labeling unevenly so i would have the indication of the actual times of measurement on the axis.
any suggestions?
Accepted Solutions


- Mark as New
- Bookmark
- Subscribe
- Mute
- Subscribe to RSS Feed
- Get Direct Link
- Report Inappropriate Content
Re: uneven intervals on the axis
If you mark your x variable as Nominal, some graphics platforms (Graph Builder and Scatterplot Matrix) will still use it with even spacing. That would seem to work in this case, where the points are evenly spaced.
For full control, an alternative is to transform the values to the scale you want, plot the transformed scale, and add labeled reflines for the "real" labels.

- Mark as New
- Bookmark
- Subscribe
- Mute
- Subscribe to RSS Feed
- Get Direct Link
- Report Inappropriate Content
Re: uneven intervals on the axis
Hi Ron,
I have this same problem and searched around and could not find a way to do this within JMP. It would be nice if the axis statement would allow you to specify the specific axis values you wanted, but it doesn't look like this is an option. The only solution I've found is to save the figure using a vector graphics output (e.g. emf, or pdf) and then edit the axis using Adobe, Inkscape or some other software that edits vector graphics.
Regards,
Tee

- Mark as New
- Bookmark
- Subscribe
- Mute
- Subscribe to RSS Feed
- Get Direct Link
- Report Inappropriate Content
Re: uneven intervals on the axis
Ron,
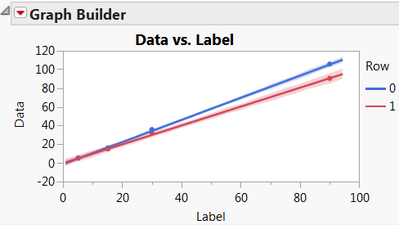
Try doing a right click on that last table in your report, make it into a data table, then stack the time intervals.
I used graph builder for the figure above and marker spacing worked out ok. Make sure your x-axis variable is numeric and continuous.
Cheers,
Byron
- Mark as New
- Bookmark
- Subscribe
- Mute
- Subscribe to RSS Feed
- Get Direct Link
- Report Inappropriate Content
Re: uneven intervals on the axis
Thanks Byron,
this is probably as close as it gets.
- Mark as New
- Bookmark
- Subscribe
- Mute
- Subscribe to RSS Feed
- Get Direct Link
- Report Inappropriate Content
Re: uneven intervals on the axis
If you mark your x variable as Nominal, some graphics platforms (Graph Builder and Scatterplot Matrix) will still use it with even spacing. That would seem to work in this case, where the points are evenly spaced.
For full control, an alternative is to transform the values to the scale you want, plot the transformed scale, and add labeled reflines for the "real" labels.
- Mark as New
- Bookmark
- Subscribe
- Mute
- Subscribe to RSS Feed
- Get Direct Link
- Report Inappropriate Content
Re: uneven intervals on the axis
Thanks Xan,
i will give it a go.
Recommended Articles
- © 2026 JMP Statistical Discovery LLC. All Rights Reserved.
- Terms of Use
- Privacy Statement
- Contact Us