- Don’t miss your chance to experience Discovery Summit Europe at our best available rate! Early bird registration through 31 Oct.
- Graph Builder Toolbar streamlines interactive graphing. Creates shortcuts on Report and GraphBuilder Helpers toolbars. Download and install the extension.
- Subscribe to RSS Feed
- Mark Topic as New
- Mark Topic as Read
- Float this Topic for Current User
- Bookmark
- Subscribe
- Mute
- Printer Friendly Page
Discussions
Solve problems, and share tips and tricks with other JMP users.- User Community
- :
- Discussions
- :
- Re: put categories into the same cell with delimiter

- Mark as New
- Bookmark
- Subscribe
- Mute
- Subscribe to RSS Feed
- Get Direct Link
- Report Inappropriate Content
put categories into the same cell with delimiter
Hi, I'm in tabulate and has the below table:
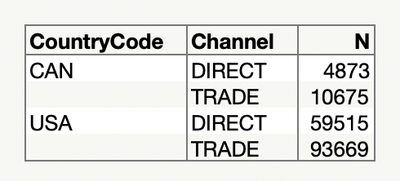
Is there a way i can make the channel into one cell using existing function, not script? like:

Thanks in advance!


- Mark as New
- Bookmark
- Subscribe
- Mute
- Subscribe to RSS Feed
- Get Direct Link
- Report Inappropriate Content
Re: put categories into the same cell with delimiter
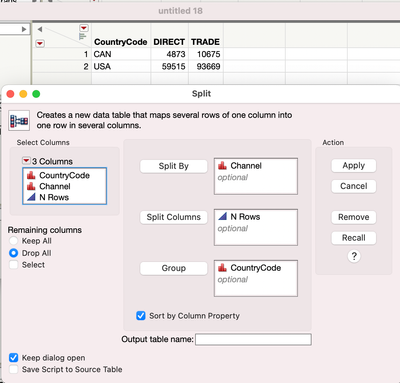
The only way I know how to do this, would be to use the Summary platform to aggregate the statistics, and then to use the Split platform to create different columns for the Direct and Trade data and then to create new columns to sum the counts and to concatenate the 2 Channels. Finally, you can then take the modified data table and use the Tabulate platform to display the results.
- Mark as New
- Bookmark
- Subscribe
- Mute
- Subscribe to RSS Feed
- Get Direct Link
- Report Inappropriate Content
Re: put categories into the same cell with delimiter
Thank you Jim! I'm stuck in the split step you mentioned- how did we get the direct trade in the right place to concatenate while having the numbers in the cells?
- Mark as New
- Bookmark
- Subscribe
- Mute
- Subscribe to RSS Feed
- Get Direct Link
- Report Inappropriate Content
Re: put categories into the same cell with delimiter
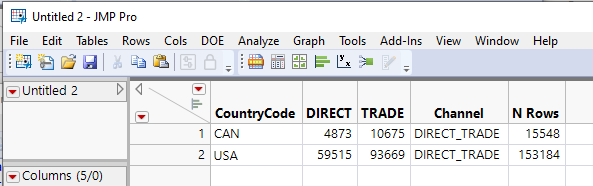
Take the split table you have created and create 2 new columns.
- Create column called Channel
- Give it the formula
Char( Column( 2 ) << get name ) || "_" || Char( Column( 3 ) << get name )
- Give it the formula
- Create a column called N Rows
- Give it the formula
:DIRECT + :TRADE
- Give it the formula
- It gives you the following data table
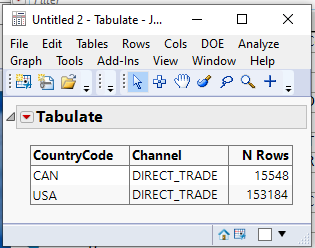
- Now use the Tabulate platform to create the Display output you want
Recommended Articles
- © 2026 JMP Statistical Discovery LLC. All Rights Reserved.
- Terms of Use
- Privacy Statement
- Contact Us