- Subscribe to RSS Feed
- Mark Topic as New
- Mark Topic as Read
- Float this Topic for Current User
- Bookmark
- Subscribe
- Mute
- Printer Friendly Page
Discussions
Solve problems, and share tips and tricks with other JMP users.- JMP User Community
- :
- Discussions
- :
- distribution of the data is not in JMP during CPK analysis

- Mark as New
- Bookmark
- Subscribe
- Mute
- Subscribe to RSS Feed
- Get Direct Link
- Report Inappropriate Content
distribution of the data is not in JMP during CPK analysis
I am doing cpk analysis and did continuous fit-->fit all to find the true distribution for the data, then run cpk. JMP provided the best option, then I did Goodness of fit to confirm by P-value, however, P <0.001 which reject the distribution JMP suggested. I assume, this means JMP do not have the proper distribution stored. My question is if I can just use the distribution to run CPK, based on the lowest AICc in JMP? Or what will be the option here for me to get correct CPK? Thanks.


- Mark as New
- Bookmark
- Subscribe
- Mute
- Subscribe to RSS Feed
- Get Direct Link
- Report Inappropriate Content
Re: distribution of the data is not in JMP during CPK analysis
I am not the right person to provide answers to your questions, but I do have some food for thought:
I believe what you are trying to do is get an estimate of the variation of whatever it is you are measuring and compare that to specifications. There are many ways to do this just as there are many indices to summarize those comparisons. ALL of the indices are estimates. There is NO correct one. The purpose of analyzing the distribution of the data is to determine what summary statistics best describe the central tendency and dispersion. Just as important (or perhaps more), is to determine if the data comes from a stable system. If not, the indices will surely not be useful.
- Mark as New
- Bookmark
- Subscribe
- Mute
- Subscribe to RSS Feed
- Get Direct Link
- Report Inappropriate Content
Re: distribution of the data is not in JMP during CPK analysis
Totally agree. Just do not have solid support for my cpk results if people question the P value in my distribution determination.

- Mark as New
- Bookmark
- Subscribe
- Mute
- Subscribe to RSS Feed
- Get Direct Link
- Report Inappropriate Content
Re: distribution of the data is not in JMP during CPK analysis
Why are these distribution models, even the 'best' one, not fitting well? Please provide a picture of the histogram in Distribution with the plot of the graph of the PDF over-laid. Also, can you provide the quantile plot using the command in the red triangle for the selected fit? It might be a data or an outlier problem.
The capability indices strongly depend on the definition of the tails of the distribution, so having a good fit is important if you plan to use the estimates from the fitted CDF in the calculation.
- Mark as New
- Bookmark
- Subscribe
- Mute
- Subscribe to RSS Feed
- Get Direct Link
- Report Inappropriate Content
Re: distribution of the data is not in JMP during CPK analysis
I attached the pic in the original post. I may wrong. The attached pic showed that JMP selected SHASH as the best fit, but goodness of fit p value is <0.001. My understanding is this p reject the hypnosis of SHASH is the distribution. the overlay seems good fit and qq plots seems good too, but I don't get it why P values is so low.


- Mark as New
- Bookmark
- Subscribe
- Mute
- Subscribe to RSS Feed
- Get Direct Link
- Report Inappropriate Content
Re: distribution of the data is not in JMP during CPK analysis
The pictures that @Mark_Bailey is looking for would be extremely helpful. As he stated, the small p-value could be caused by an outlier. The pictures will help determine that. Also, how many observations do you have? With enough data, any small discrepancy that is not of any practical significance could be flagged as statistically significant. Again, the pictures that Mark is asking for will help determine that, too.
- Mark as New
- Bookmark
- Subscribe
- Mute
- Subscribe to RSS Feed
- Get Direct Link
- Report Inappropriate Content
Re: distribution of the data is not in JMP during CPK analysis
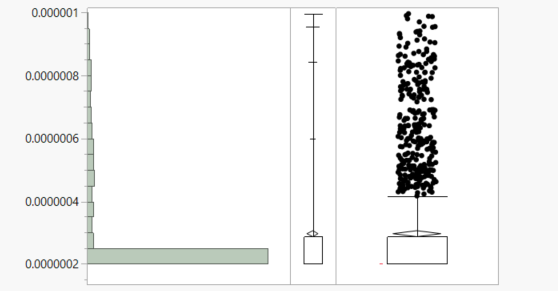
I have over 1k obs, just the natural of the data is one peak followed by a skinny tail.
- Mark as New
- Bookmark
- Subscribe
- Mute
- Subscribe to RSS Feed
- Get Direct Link
- Report Inappropriate Content
Re: distribution of the data is not in JMP during CPK analysis
These tests for goodness of fit are notoriously sensitive when the amount of data is large. The idea is simply that real data, in large quantities, rarely follow an idealistic distribution model. Even large quantities of data from sampling a ideal population (e.g., random number generator for a given distribution) will often find a statistical significant departure from the model, which is a type I error.
- Mark as New
- Bookmark
- Subscribe
- Mute
- Subscribe to RSS Feed
- Get Direct Link
- Report Inappropriate Content
Re: distribution of the data is not in JMP during CPK analysis
The plots (i.e., histogram and quantile plot) are not visible in either of the pictures that you provided.
- Mark as New
- Bookmark
- Subscribe
- Mute
- Subscribe to RSS Feed
- Get Direct Link
- Report Inappropriate Content
Re: distribution of the data is not in JMP during CPK analysis
Here is the histogram and quantile plot.
Recommended Articles
- © 2026 JMP Statistical Discovery LLC. All Rights Reserved.
- Terms of Use
- Privacy Statement
- Contact Us