- DownloadSemiconductor Toolkit: Tools to create wafer maps, add wafer geometry to graphics, explore die defects & compare wafers.
- Discovery Summit 2026: Early User Edition - September 23-24.Register. It's free.
- Subscribe to RSS Feed
- Mark Topic as New
- Mark Topic as Read
- Float this Topic for Current User
- Bookmark
- Subscribe
- Mute
- Printer Friendly Page
Discussions
Solve problems, and share tips and tricks with other JMP users.- User Community
- :
- Discussions
- :
- creating a mean table with p-vaue

- Mark as New
- Bookmark
- Subscribe
- Mute
- Subscribe to RSS Feed
- Get Direct Link
- Report Inappropriate Content
creating a mean table with p-vaue
Looking to create a data output table from an comparison of means analysis that shows the mean of each atrribute by sample with p-value to show if the mean values are significantly different. How can I do that in JMP? I can generate a table using tabulate but cant seem to add p-value which is generated during hte one way anova analysis


- Mark as New
- Bookmark
- Subscribe
- Mute
- Subscribe to RSS Feed
- Get Direct Link
- Report Inappropriate Content
Re: creating a mean table with p-vaue
If you go to
Analyze==>Screening==>Response Screening
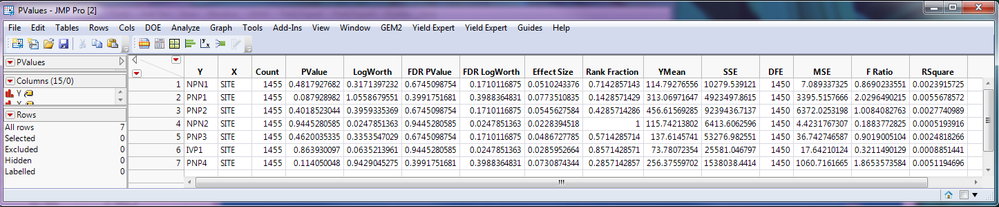
You can enter in all of your Y variables, and you X variable(s) and it will generate a data table with your results, including the p-values

- Mark as New
- Bookmark
- Subscribe
- Mute
- Subscribe to RSS Feed
- Get Direct Link
- Report Inappropriate Content
Re: creating a mean table with p-vaue
thanks for the suggestion. Is there a way to access the output table of Response Screening from jmp script?
I would like to iterate through the table and pick up all the row numbers that have a RSquared > 0.95.
This output table doesnt seem to be the current data table.
- Mark as New
- Bookmark
- Subscribe
- Mute
- Subscribe to RSS Feed
- Get Direct Link
- Report Inappropriate Content
Re: creating a mean table with p-vaue
Here is an example of how to do that taken from the Scripting Index
Help==>Scripting Index==>Response Screening==>Get PValues
Names Default To Here( 1 );
Open( "$Sample_Data/Probe.jmp" );
obj =
Response Screening(
	X( :Process ),
	Y( Eval( 8 :: 394 ) ),
	Save Outlier Indicator
);
dtOut = obj << Get PValues ;
show( dtOut );
dtOut << Select Where( :RSquare > .95 );
I modified it very slightly, to add the pointer to the "PValues" data table which you can then use to do the selection of the RSquare values. I do recomment that you examine the FDR Logworth values. When doing so many tests, the FDR Logworth will help you determine which of the tests are real, and which are due to alpha slipping.
- Mark as New
- Bookmark
- Subscribe
- Mute
- Subscribe to RSS Feed
- Get Direct Link
- Report Inappropriate Content
Re: creating a mean table with p-vaue
Actually my data set has about 6000 columns all with p-value < 0.01 and many with a significant FDR logworth. However, some of the columns correlate to other columns with RSquare > 0.95 (similar test results). So currenly I'm running response screening of all columns vs all columns, grouping those columns that correlate with RSquare > 0.95 and then keeping just 1 of the correlating columns per group. It does take a few hours (~1000 rows) to run the script though for a decent reduction in number of columns.
Would be great if there is a faster way to group correlating columns together and then just keep 1 column per group. Pls share if there's a better way to do this.
- Mark as New
- Bookmark
- Subscribe
- Mute
- Subscribe to RSS Feed
- Get Direct Link
- Report Inappropriate Content
Re: creating a mean table with p-vaue
You could create a correlation matrix using
Analyze==>Multivariate Methods==>Multivariate
or use Prinicpal Components analysis
Analyze==:Multivariate Methods==>Principal Components


- Mark as New
- Bookmark
- Subscribe
- Mute
- Subscribe to RSS Feed
- Get Direct Link
- Report Inappropriate Content
Re: creating a mean table with p-vaue
The procedure that you are looking for is called 'variable clustering.' The Cluster Variables command in the Analyze menu will launch the JMP platform for this purpose.
Please see Help > Books > Multivariate Methods > Chapter 11: Cluster Variables for more information.
- Mark as New
- Bookmark
- Subscribe
- Mute
- Subscribe to RSS Feed
- Get Direct Link
- Report Inappropriate Content
Re: creating a mean table with p-vaue
Use the Oneway platform. Start by selecting Analyze > Fit Y by X. I assume that you have a numeric variable stored in a data column using the continuous modeling type for the Y role. I also assume that you have a categorical variable in a data column using the nominal modeling type. Put that column in the X role.
Click the red triangle next to Oneway and select Compare Means > Tukey-Kramer. You will find the answer several different ways. The last report shows what you want. Remember that you can right-click on this last report and select Make Into Data Table if you need to do something else with results.
- Mark as New
- Bookmark
- Subscribe
- Mute
- Subscribe to RSS Feed
- Get Direct Link
- Report Inappropriate Content
Re: creating a mean table with p-vaue
Example: I have sample 1 (control) , sample 2 and sample 3. I recorded dimension data for length, width, and height.
I am comparing if sample 1 (control) is significantly different than sample 2 and 3 for each length, width and height.
So when I create the one way it is just for sample 1, 2 & 3 for length. How can I create a table with p-value for length, width and height. Do I need to go to the red triangle for each dimension, compare mean then create the table? This seems inefficient. Could I just use the tabulate function to create the table of means then in the data table add a formula to create the p-value?

 Community Manager
- Mark as New
- Bookmark
- Subscribe
- Mute
- Subscribe to RSS Feed
- Get Direct Link
- Report Inappropriate Content
Re: creating a mean table with p-vaue
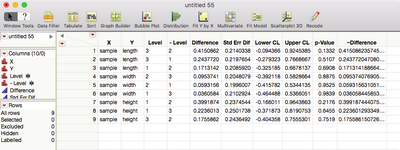
You can broadcast the Compare Means command across your report and then use Make Combined Data Table to make one data table from all the individual report tables.
Start with Fit Y by X using sample as X and length, width, height as Y.
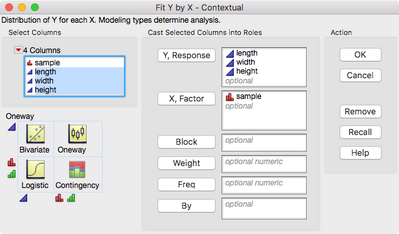
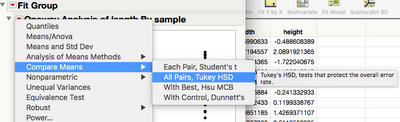
Then, in the report, hold the Ctrl key (Windows) or Command key (Mac) down and choose Compare Means -> All Pairs, Tukey HSD.
Then in the report table that contains the p-Values, right click and choose Make Combined Data Table.
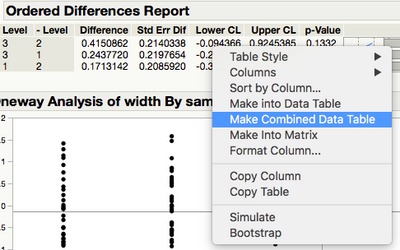
That gets you one data table with all the p-values.
Recommended Articles
- © 2026 JMP Statistical Discovery LLC. All Rights Reserved.
- Terms of Use
- Privacy Statement
- Contact Us