- See how to interactively organize and restructure data for analysis. Register for May 29 webinar, 2pm US ET.
- Subscribe to RSS Feed
- Mark Topic as New
- Mark Topic as Read
- Float this Topic for Current User
- Bookmark
- Subscribe
- Mute
- Printer Friendly Page
Discussions
Solve problems, and share tips and tricks with other JMP users.- JMP User Community
- :
- Discussions
- :
- Re: Why my saved Interactive Html (Graph Builder) & Local Filter not interactive...

- Mark as New
- Bookmark
- Subscribe
- Mute
- Subscribe to RSS Feed
- Get Direct Link
- Report Inappropriate Content
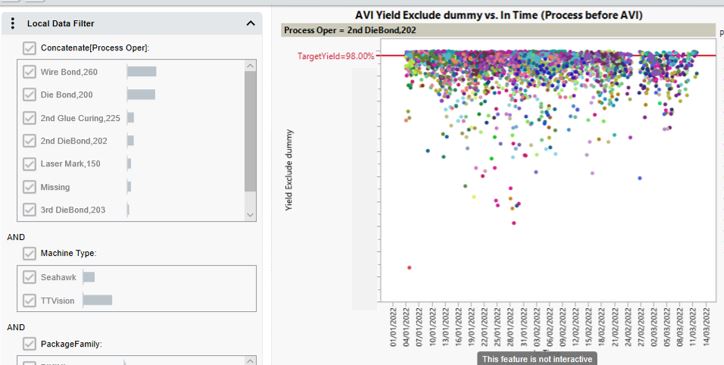
Why my saved Interactive Html (Graph Builder) & Local Filter not interactive?
Hello expert,
I'm almost at the end of my project for 2nd batch of interactive html report but my beautiful graphs saved in .html are not interactive.
I used similar logic to my 1st batch of interactive html report (which is successfully automated and interactive).
Why my interactive report not interactive?
What can I do to make it interactive. I've added the Top header but didn't work out.
//create Graph Builder
Names Default To Here( 1 );
dt3 = Data Table( "JoinT" );
gb = dt3 << Graph Builder(
	Size( 605, 3451 ),
	Show Control Panel( 0 ),
	Lock Scales( 1 ),
	Link Page Axes( "X and Y" ),
	Variables(
		X( :In Time ),
		Y( :Yield Exclude dummy ),
		Page( :Process Oper ),
		Overlay( :Process Mach No )
	),
	Elements( Points( X, Y, Legend( 9 ) ) ),
	Local Data Filter(
		Add Filter(
			columns(
				Transform Column(
					"Concatenate[Process Oper]",
					Character,
					Formula( Concat( :Process Oper ) )
				),
				:Machine Type,
				:PackageFamily,
				:Machine No,
				:Recipe,
				:Process Mach No
			),
			Display(
				Transform Column(
					"Concatenate[Process Oper]",
					Character,
					Formula( Concat( :Process Oper ) )
				),
				"Single Category Display"
			),
			Display( :PackageFamily, "Single Category Display" ),
			Display(
				:Machine No,
				"Single Category Display",
				Find( Set Text( "" ) )
			),
			Display( :Recipe, "Single Category Display", Find( Set Text( "" ) ) ),
			Display(
				:Process Mach No,
				"Single Category Display",
				Find( Set Text( "" ) )
			),
			Order By Count(
				Transform Column(
					"Concatenate[Process Oper]",
					Character,
					Formula( Concat( :Process Oper ) )
				)
			)
		)
	),
	SendToReport(
		Dispatch(
			{},
			"In Time",
			ScaleBox,
			{Format( "d/m/y", 10 ), Min( 3723595037 ), Max( 3730267481.28 ),
			Interval( "Day" ), Inc( 1 ), Minor Ticks( 0 )}
		),
		Dispatch(
			{},
			"In Time",
			ScaleBox( 2 ),
			{Format( "d/m/y", 10 ), Min( 3723840000 ), Max( 3730079028.96 ),
			Interval( "Day" ), Inc( 10 ), Minor Ticks( 0 )}
		),
		Dispatch(
			{},
			"In Time",
			ScaleBox( 3 ),
			{Format( "d/m/y", 10 ), Min( 3723796743.08 ), Max( 3725242379.92 ),
			Interval( "Day" ), Inc( 2 ), Minor Ticks( 1 )}
		),
		Dispatch(
			{},
			"In Time",
			ScaleBox( 4 ),
			{Format( "d/m/y", 10 ), Min( 3723840000 ), Max( 3730002981.72 ),
			Interval( "Day" ), Inc( 10 ), Minor Ticks( 0 )}
		),
		Dispatch(
			{},
			"In Time",
			ScaleBox( 5 ),
			{Format( "d/m/y", 10 ), Min( 3723840000 ), Max( 3730063004.8 ),
			Interval( "Day" ), Inc( 10 ), Minor Ticks( 0 )}
		),
		Dispatch(
			{},
			"In Time",
			ScaleBox( 6 ),
			{Format( "d/m/y", 10 ), Min( 3723840000 ), Max( 3730200253.12 ),
			Interval( "Day" ), Inc( 10 ), Minor Ticks( 0 )}
		),
		Dispatch(
			{},
			"In Time",
			ScaleBox( 7 ),
			{Format( "d/m/y", 10 ), Min( 3723840000 ), Max( 3730020656.4 ),
			Interval( "Day" ), Inc( 10 ), Minor Ticks( 0 )}
		),
		Dispatch(
			{},
			"In Time",
			ScaleBox( 8 ),
			{Format( "d/m/y", 10 ), Min( 3723595299.52 ), Max( 3730267481.28 ),
			Interval( "Day" ), Inc( 10 ), Minor Ticks( 0 )}
		),
		Dispatch(
			{},
			"Yield Exclude dummy",
			ScaleBox,
			{Format( "Fixed Dec", 15, 2 ), Min( 0 ), Max( 105 ), Inc( 10 ),
			Minor Ticks( 1 ), Add Ref Line(
				98,
				"Solid",
				"Medium Dark Red",
				"TargetYield=98.00%",
				2
			)}
		),
		Dispatch(
			{},
			"Yield Exclude dummy",
			ScaleBox( 2 ),
			{Format( "Fixed Dec", 15, 0 ), Min( 13.63 ), Max( 102.111427606729 ),
			Inc( 10 ), Minor Ticks( 0 )}
		),
		Dispatch(
			{},
			"Yield Exclude dummy",
			ScaleBox( 3 ),
			{Format( "Fixed Dec", 15, 1 ), Min( 97.970970312416 ),
			Max( 99.8921310582744 ), Inc( 0.5 ), Minor Ticks( 1 )}
		),
		Dispatch(
			{},
			"Yield Exclude dummy",
			ScaleBox( 4 ),
			{Format( "Fixed Dec", 15, 1 ), Min( 95.8240945419339 ),
			Max( 100.016768985686 ), Inc( 0.5 ), Minor Ticks( 0 )}
		),
		Dispatch(
			{},
			"Yield Exclude dummy",
			ScaleBox( 5 ),
			{Format( "Fixed Dec", 15, 1 ), Min( 95.8220034130674 ),
			Max( 100.057545297737 ), Inc( 0.5 ), Minor Ticks( 0 )}
		),
		Dispatch(
			{},
			"Yield Exclude dummy",
			ScaleBox( 6 ),
			{Format( "Fixed Dec", 15, 0 ), Min( 4.52872 ), Max( 103.59928 ),
			Inc( 10 ), Minor Ticks( 0 )}
		),
		Dispatch(
			{},
			"Yield Exclude dummy",
			ScaleBox( 7 ),
			{Format( "Fixed Dec", 15, 0 ), Min( 43.0752 ), Max( 101.7948 ),
			Inc( 10 ), Minor Ticks( 1 )}
		),
		Dispatch(
			{},
			"Yield Exclude dummy",
			ScaleBox( 8 ),
			{Format( "Fixed Dec", 15, 0 ), Min( 4.52792 ), Max( 103.62008 ),
			Inc( 10 ), Minor Ticks( 0 )}
		),
		Dispatch(
			{},
			"graph title",
			TextEditBox,
			{Set Text( "AVI Yield Exclude dummy vs. In Time (Process before AVI)" )}
		)
	)
);
gb << Bring Window to Front;
//Get the container of the platform
tr = gb << Top Report;
tr << Save Interactive HTML("C:\Users\jmpuser2020c\Desktop\Manufacturing Yield Dashboard\AVI\AVIAutoReport\ProcessBeforeMCAVIYield.html");
Accepted Solutions

- Mark as New
- Bookmark
- Subscribe
- Mute
- Subscribe to RSS Feed
- Get Direct Link
- Report Inappropriate Content
Re: Why my saved Interactive Html (Graph Builder) & Local Filter not interactive?
Hi @WebDesignesCrow ,
Thank you for sharing your log output.
In the lines starting with "Interactive HTML:" I can see that there are two Columns with modeling types that are not supported by Interactive HTML. "Process Mach No" and "Process Oper".
The following lines create these columns by combining other columns:
//combine Mach No with Oven No into "Process Mach No"
dt2 << Combine Columns (
	delimiter(","),
	Columns(
	 :Mach No,
	 :Oven No
	 ),
	Column Name("Process Mach No")
	);
//combine Oper Desc & Cur Oper into "Process Oper"
dt2 << Combine Columns (
	delimiter(","),
	Columns(
	 :Oper Desc,
	 :Cur Oper
	 ),
	Column Name("Process Oper")
	);
The result of Combine Columns is a multiple response column which is the modeling type that is not supported by Interactive HTML.
You can convert the multiple response columns into columns with Data Type = Character and Modeling Type = Nominal, using the Concat transform. I see you have already used this in creating the Local Data Filter:
Transform Column(
					"Concatenate[Process Oper]",
					Character,
					Formula( Concat( :Process Oper ) )
				),
Or, rather than using Combine Columns to make a multiple response columns, you could Concatenate the columns using a comma separator. It would be something like the following:
Transform Column(
				"Process Oper",
				Character,
				Formula( Char( dt2:Oper Desc ) || ", " || dt2:Cur Oper )
			)
In the Formula, you may not need to use the Char() function if the Oper Desc column is already a Character data type and you might need to add it for Cur Oper if the Cur Oper column is not a Character data type.
These are just suggestions. You may be able to find a better way to avoid using the multiple response modeling type for reports you want to export to interactive HTML.
I hope this helps.
~John

- Mark as New
- Bookmark
- Subscribe
- Mute
- Subscribe to RSS Feed
- Get Direct Link
- Report Inappropriate Content
Re: Why my saved Interactive Html (Graph Builder) & Local Filter not interactive?
- Mark as New
- Bookmark
- Subscribe
- Mute
- Subscribe to RSS Feed
- Get Direct Link
- Report Inappropriate Content
Re: Why my saved Interactive Html (Graph Builder) & Local Filter not interactive?
Thanks @Craige_Hales !,
I will try above method as well (as alternative).
For now, I just revisit the whole script and change the earlier scripting during combination of those two columns.
//combine Mach No with Oven No into "Process Mach No"
dt2 << new column ("Process Mach No", character, Formula(:Mach No || :Oven No));
dt2 << new column ("Process Oper", character, "Nominal", Formula( Char( :Cur Oper ) || "_" || :Oper Desc ));

- Mark as New
- Bookmark
- Subscribe
- Mute
- Subscribe to RSS Feed
- Get Direct Link
- Report Inappropriate Content
Re: Why my saved Interactive Html (Graph Builder) & Local Filter not interactive?
I'll tag a person who knows a lot of this topic: @John_Powell_JMP , but most likely there is some feature in the graph / report which isn't (yet) supported by interactive htmls.
- Mark as New
- Bookmark
- Subscribe
- Mute
- Subscribe to RSS Feed
- Get Direct Link
- Report Inappropriate Content
Re: Why my saved Interactive Html (Graph Builder) & Local Filter not interactive?
Hi @WebDesignesCrow,
Jarmo is correct. There is a feature or a combination of conditions in your graph that are not supported by Interactive HTML. Looking at the script and not knowing what version of JMP you are using, I can make a few guesses, but the best way to find out is to look at the output in JMP's Log (View>Log) after you run the script. You should see one or more lines starting with "Interactive HTML:"
If you copy these lines in a reply here and let me know what version of JMP you are using, I may be able to find a way to build the graphs differently to avoid the conditions that are causing the graphs to become non-interactive.
~John
- Mark as New
- Bookmark
- Subscribe
- Mute
- Subscribe to RSS Feed
- Get Direct Link
- Report Inappropriate Content
Re: Why my saved Interactive Html (Graph Builder) & Local Filter not interactive?
Hi John.
Thank you. I'm using JMP 15. These are the lines from log.
//Open Seahawk & TTVision Table
dt2= Open(
	"\\domi8\Production Report\Manufacturing Yield Dashboard\AVI\AVIYield (Datasheet).xlsx",
	Worksheets( {"Seahawk"} ),
	Use for all sheets( 1 ),
	Concatenate Worksheets( 1 ),
	Create Concatenation Column( 0 ),
	Worksheet Settings(
		1,
		Has Column Headers( 1 ),
		Number of Rows in Headers( 1 ),
		Headers Start on Row( 1 ),
		Data Starts on Row( 2 ),
		Data Starts on Column( 1 ),
		Data Ends on Row( 0 ),
		Data Ends on Column( 0 ),
		Replicated Spanned Rows( 1 ),
		Replicated Spanned Headers( 0 ),
		Suppress Hidden Rows( 1 ),
		Suppress Hidden Columns( 1 ),
		Suppress Empty Columns( 1 ),
		Treat as Hierarchy( 0 ),
		Multiple Series Stack( 0 ),
		Import Cell Colors( 0 ),
		Limit Column Detect( 0 ),
		Column Separator String( "-" )
	)
);
Wait( 1);
dt2 << delete columns( [2]);
dt2 << Select Where(Is missing(:Machine Type) | Is missing(:Recipe) | is missing(:Device)) << Delete Rows;
dt2:Start Lot Time << Data Type( Numeric );
dt2:End Lot Time << Data Type( Numeric);
dt3= Open(
	"\\domi8\Production Report\Manufacturing Yield Dashboard\AVI\AVIYield (Datasheet).xlsx",
	Worksheets( {"TTVision"} ),
	Use for all sheets( 1 ),
	Concatenate Worksheets( 1 ),
	Create Concatenation Column( 0 ),
	Worksheet Settings(
		1,
		Has Column Headers( 1 ),
		Number of Rows in Headers( 1 ),
		Headers Start on Row( 1 ),
		Data Starts on Row( 2 ),
		Data Starts on Column( 1 ),
		Data Ends on Row( 0 ),
		Data Ends on Column( 0 ),
		Replicated Spanned Rows( 1 ),
		Replicated Spanned Headers( 0 ),
		Suppress Hidden Rows( 1 ),
		Suppress Hidden Columns( 1 ),
		Suppress Empty Columns( 1 ),
		Treat as Hierarchy( 0 ),
		Multiple Series Stack( 0 ),
		Import Cell Colors( 0 ),
		Limit Column Detect( 0 ),
		Column Separator String( "-" )
	)
);
Wait( 1);
dt3 << delete columns( [2]);
dt3 << Select Where(Is missing(:Machine Type) | Is missing(:Recipe) | is missing(:Device)) << Delete Rows;
//Concatenation Seahawk & TTVision Table
dt4=Data Table( "Seahawk" ) << Concatenate(
	Data Table( "TTVision" ),
	Output Table( "AVIYield (Datasheet)" )
);
Close(dt2);
Close(dt3);

//Open Data3ITDeviceListTable
dt= Open(
	"\\domi8\Production Report\Manufacturing Yield Dashboard\AVI\AVIYield (Datasheet).xlsx",
	Worksheets( "Domi3_ITDevice" ),
	Use for all sheets( 1 ),
	Concatenate Worksheets( 0 ),
	Create Concatenation Column( 0 ),
	Worksheet Settings(
		1,
		Has Column Headers( 1 ),
		Number of Rows in Headers( 1 ),
		Headers Start on Row( 1 ),
		Data Starts on Row( 2 ),
		Data Starts on Column( 1 ),
		Data Ends on Row( 0 ),
		Data Ends on Column( 0 ),
		Replicated Spanned Rows( 1 ),
		Replicated Spanned Headers( 0 ),
		Suppress Hidden Rows( 1 ),
		Suppress Hidden Columns( 1 ),
		Suppress Empty Columns( 1 ),
		Treat as Hierarchy( 0 ),
		Multiple Series Stack( 0 ),
		Import Cell Colors( 0 ),
		Limit Column Detect( 0 ),
		Column Separator String( "-" )
	)
);
:DeviceName << Set Name("Device");
//VLOOKUP Table (dt=Domi3_ITDevice) to add matching device with (dt4=AVIYield Datasheet). Add new column name Package
dt4 << update (with (dt), by matching columns (dt4:Device==dt:Device), add columns from update table(:PackageFamily));
Close(dt);
//Clean-up data
//In Recipe, recode BDD0762 DBA-xKS_V4 with BDD0762 DBA-XKS_V4
//In Recipe, recode BDD0708_DWY_MKR_V3 with BDD0708_DWY_MK_V3
//In Recipe, replace recipe string which contain " " with "_"
Names Default To Here( 1 );
dt = Data Table( "AVIYield (Datasheet)" );
dt << Begin Data Update;
dt << Recode Column(
	dt:Recipe,
	{Map Value(
		_rcOrig,
		{"BDD0762 DBA-xKS_V4", "BDD0762 DBA-XKS_V4"},
		Unmatched( _rcNow )
	)},
	Target Column( :Recipe ));
dt << End Data Update;
Names Default To Here( 1 );
dt = Data Table( "AVIYield (Datasheet)" );
dt << Begin Data Update;
dt << Recode Column(
	dt:Recipe,
	{Map Value(
		_rcOrig,
		{"BDD0708_DWY_MKR_V3", "BDD0708_DWY_MK_V3"},
		Unmatched( _rcNow )
	)},
	Target Column( :Recipe ));
Names Default To Here( 1 );
dt = Data Table( "AVIYield (Datasheet)" );
dt << Begin Data Update;
dt << Recode Column(
	dt:Recipe,
	{Substitute( _rcNow, " ", "_" )},
	Target Column( :Recipe ));
dt << End Data Update;
//Remove data with lot size <10,000 (not required for analysis)
Current Data Table() << Row Selection(
	Select where( :Total Inspected Unit < 10000 ));
r = dt << Delete Rows;
Show( r );
//Remove data with lot number does not contain ".0" (not required for analysis)
Current Data Table() << Row Selection( Select where( !Contains( :Lot No, ".0" ) ) );
r = dt << Delete Rows;
Show( r );
//Sort to Ascending Start Lot Date (Numeric)
Names Default To Here( 1 );
dt = Data Table( "AVIYield (Datasheet)" );
dt << Sort( replace table, By( :End Lot Time), Order( Ascending));
//Change Date Format (Time m/d/y h:m:s)
:End Lot Time
<< Data Type( Numeric)
<< Format( "d/m/y h:m:s")
<< Modeling Type(continuous)
;
//set Label for Machine No, Lot No, Base Part (Device), Recipe
dt << set label columns( :Machine No, :Lot No, :Device, :Recipe );
//create group columns for Seahawk & TTV Defects
dt << group columns( "SeahawkDefects", :FBMissing Bond :: :SBBall Accuracy );
dt << group columns( "TTVDefects etc.", :Name( "NU-No Unit" ), 15 );
//open Process before AVI table
wait(1);
dt2 = Open(
			"C:\Users\jmpuser2020c\Desktop\Manufacturing Yield Dashboard\AVI\ProcessBeforeAVIMatching\Process_History_LotNoListingBeforeAVI.xlsx",
			Worksheets(
				{"2ndWirebond", "Wirebond", "2ndGlueCuring", "4thDiebond",
				"3rdDiebond", "2ndDiebond", "Diebond", "LM"}
			),
			Use for all sheets( 1 ),
			Concatenate Worksheets( 1 ),
			Create Concatenation Column( 0 ),
			Worksheet Settings(
				1,
				Has Column Headers( 1 ),
				Number of Rows in Headers( 1 ),
				Headers Start on Row( 1 ),
				Data Starts on Row( 2 ),
				Data Starts on Column( 1 ),
				Data Ends on Row( 0 ),
				Data Ends on Column( 0 ),
				Replicated Spanned Rows( 1 ),
				Replicated Spanned Headers( 0 ),
				Suppress Hidden Rows( 1 ),
				Suppress Hidden Columns( 1 ),
				Suppress Empty Columns( 1 ),
				Treat as Hierarchy( 0 ),
				Multiple Series Stack( 0 ),
				Import Cell Colors( 0 ),
				Limit Column Detect( 0 ),
				Column Separator String( "-" )
			)
		);
wait(1);
//combine Mach No with Oven No into "Process Mach No"
dt2 << Combine Columns (
	delimiter(","),
	Columns(
	 :Mach No,
	 :Oven No
	 ),
	Column Name("Process Mach No")
	);
//combine Oper Desc & Cur Oper into "Process Oper"
dt2 << Combine Columns (
	delimiter(","),
	Columns(
	 :Oper Desc,
	 :Cur Oper
	 ),
	Column Name("Process Oper")
	);
//delete unused column
dt2 << Delete Columns ( :Oper Desc, :Cur Oper, :In Emp Name, :Out1Emp Name, :PCby, :In Qty, :Out Qty, :Yield, :Mach No, :Out2Emp Name, :In Temp, :Out Temp, :Out Emp Name, :Oven No, :Out3Emp Name, :Device );
//set Label for Lot No, Process Mach No, Process Oper
dt2 << set label columns( :Lot No, :Process Mach No, :Process Oper );
//Sort to Ascending Start Lot Date (Numeric)
Names Default To Here( 1 );
dt2 = Data Table( "Process_History_LotNoListingBeforeAVI" );
dt2 << Sort( replace table, By( :Out Time), Order( Ascending));
//join table AVI Yield Datasheet & ProcessHistory
Data Table( "Process_History_LotNoListingBeforeAVI" ) <<
Join(
	With( Data Table( "AVIYield (Datasheet)" ) ),
	SelectWith(
		:Machine Type,
		:Machine No,
		:Lot No,
		:Device,
		:Recipe,
		:Start Lot Time,
		:End Lot Time,
		:Total Inspected Unit,
		:Total Dummy Unit,
		:Total Reject Unit,
		:Overall Yield Include dummy,
		:Yield Exclude dummy,
		:FBMissing Bond,
		:FBAccuracy,
		:FBBroken Wire,
		:FBBall Size,
		:SBMissing Bond,
		:SBPlacement,
		:SBBroken Wire,
		:SBWedge Size,
		:WTDeviation,
		:WTBroken Wire,
		:Die Shift,
		:Die Surface,
		:Die Rotate,
		:Die Epoxy Insuff,
		:Die Expoxy Excess,
		:Die Substrate,
		:SBBall Missing Bond,
		:SBBall Broken Wire,
		:SBBall Accuracy,
		:Name( "NU-No Unit" ),
		:Name( "DU-Destroy Unit" ),
		:Name( "ID-Incomplete Die" ),
		:Name( "DED-Die Edge Defect" ),
		:Name( "DP-Die Placement" ),
		:Name( "EG-Excessive Glue" ),
		:Name( "IG-Insufficient Glue" ),
		:Name( "DO-Die Orientation" ),
		:Name( "NWB-No Wire Bond" ),
		:Name( "MW-Multiple Wire" ),
		:Name( "BP-Ball Placement" ),
		:Name( "DW-Distorted Wire" ),
		:Name( "IW-Incomplete Wire" ),
		:Name( "FM-Foreign Material" ),
		:Name( "MP-Missing Phosphor" ),
		:PackageFamily
	),
	Select( :Process Oper, :Process Mach No, :In Time, :Out Time ),
	By Matching Columns( :Lot No = :Lot No ),
	Drop multiples( 0, 0 ),
	Include Nonmatches( 0, 1 ),
	Preserve main table order( 1 ),
	Output Table( "JoinT" )
);
close (dt2);
close (dt);
//create Graph Builder
Names Default To Here( 1 );
dt3 = Data Table( "JoinT" );
gb = dt3 << Graph Builder(
	Size( 605, 3451 ),
	Show Control Panel( 0 ),
	Lock Scales( 1 ),
	Link Page Axes( "X and Y" ),
	Variables(
		X( :In Time ),
		Y( :Yield Exclude dummy ),
		Page( :Process Oper ),
		Overlay( :Process Mach No )
	),
	Elements( Points( X, Y, Legend( 9 ) ) ),
	Local Data Filter(
		Add Filter(
			columns(
				Transform Column(
					"Concatenate[Process Oper]",
					Character,
					Formula( Concat( :Process Oper ) )
				),
				:Machine Type,
				:PackageFamily,
				:Machine No,
				:Recipe,
				:Process Mach No
			),
			Display(
				Transform Column(
					"Concatenate[Process Oper]",
					Character,
					Formula( Concat( :Process Oper ) )
				),
				"Single Category Display"
			),
			Display( :PackageFamily, "Single Category Display" ),
			Display(
				:Machine No,
				"Single Category Display",
				Find( Set Text( "" ) )
			),
			Display( :Recipe, "Single Category Display", Find( Set Text( "" ) ) ),
			Display(
				:Process Mach No,
				"Single Category Display",
				Find( Set Text( "" ) )
			),
			Order By Count(
				Transform Column(
					"Concatenate[Process Oper]",
					Character,
					Formula( Concat( :Process Oper ) )
				)
			)
		)
	),
	SendToReport(
		Dispatch(
			{},
			"In Time",
			ScaleBox,
			{Format( "d/m/y", 10 ), Min( 3723595037 ), Max( 3730267481.28 ),
			Interval( "Day" ), Inc( 1 ), Minor Ticks( 0 )}
		),
		Dispatch(
			{},
			"In Time",
			ScaleBox( 2 ),
			{Format( "d/m/y", 10 ), Min( 3723840000 ), Max( 3730079028.96 ),
			Interval( "Day" ), Inc( 10 ), Minor Ticks( 0 )}
		),
		Dispatch(
			{},
			"In Time",
			ScaleBox( 3 ),
			{Format( "d/m/y", 10 ), Min( 3723796743.08 ), Max( 3725242379.92 ),
			Interval( "Day" ), Inc( 2 ), Minor Ticks( 1 )}
		),
		Dispatch(
			{},
			"In Time",
			ScaleBox( 4 ),
			{Format( "d/m/y", 10 ), Min( 3723840000 ), Max( 3730002981.72 ),
			Interval( "Day" ), Inc( 10 ), Minor Ticks( 0 )}
		),
		Dispatch(
			{},
			"In Time",
			ScaleBox( 5 ),
			{Format( "d/m/y", 10 ), Min( 3723840000 ), Max( 3730063004.8 ),
			Interval( "Day" ), Inc( 10 ), Minor Ticks( 0 )}
		),
		Dispatch(
			{},
			"In Time",
			ScaleBox( 6 ),
			{Format( "d/m/y", 10 ), Min( 3723840000 ), Max( 3730200253.12 ),
			Interval( "Day" ), Inc( 10 ), Minor Ticks( 0 )}
		),
		Dispatch(
			{},
			"In Time",
			ScaleBox( 7 ),
			{Format( "d/m/y", 10 ), Min( 3723840000 ), Max( 3730020656.4 ),
			Interval( "Day" ), Inc( 10 ), Minor Ticks( 0 )}
		),
		Dispatch(
			{},
			"In Time",
			ScaleBox( 8 ),
			{Format( "d/m/y", 10 ), Min( 3723595299.52 ), Max( 3730267481.28 ),
			Interval( "Day" ), Inc( 10 ), Minor Ticks( 0 )}
		),
		Dispatch(
			{},
			"Yield Exclude dummy",
			ScaleBox,
			{Format( "Fixed Dec", 15, 2 ), Min( 0 ), Max( 105 ), Inc( 10 ),
			Minor Ticks( 1 ), Add Ref Line(
				98,
				"Solid",
				"Medium Dark Red",
				"TargetYield=98.00%",
				2
			)}
		),
		Dispatch(
			{},
			"Yield Exclude dummy",
			ScaleBox( 2 ),
			{Format( "Fixed Dec", 15, 0 ), Min( 13.63 ), Max( 102.111427606729 ),
			Inc( 10 ), Minor Ticks( 0 )}
		),
		Dispatch(
			{},
			"Yield Exclude dummy",
			ScaleBox( 3 ),
			{Format( "Fixed Dec", 15, 1 ), Min( 97.970970312416 ),
			Max( 99.8921310582744 ), Inc( 0.5 ), Minor Ticks( 1 )}
		),
		Dispatch(
			{},
			"Yield Exclude dummy",
			ScaleBox( 4 ),
			{Format( "Fixed Dec", 15, 1 ), Min( 95.8240945419339 ),
			Max( 100.016768985686 ), Inc( 0.5 ), Minor Ticks( 0 )}
		),
		Dispatch(
			{},
			"Yield Exclude dummy",
			ScaleBox( 5 ),
			{Format( "Fixed Dec", 15, 1 ), Min( 95.8220034130674 ),
			Max( 100.057545297737 ), Inc( 0.5 ), Minor Ticks( 0 )}
		),
		Dispatch(
			{},
			"Yield Exclude dummy",
			ScaleBox( 6 ),
			{Format( "Fixed Dec", 15, 0 ), Min( 4.52872 ), Max( 103.59928 ),
			Inc( 10 ), Minor Ticks( 0 )}
		),
		Dispatch(
			{},
			"Yield Exclude dummy",
			ScaleBox( 7 ),
			{Format( "Fixed Dec", 15, 0 ), Min( 43.0752 ), Max( 101.7948 ),
			Inc( 10 ), Minor Ticks( 1 )}
		),
		Dispatch(
			{},
			"Yield Exclude dummy",
			ScaleBox( 8 ),
			{Format( "Fixed Dec", 15, 0 ), Min( 4.52792 ), Max( 103.62008 ),
			Inc( 10 ), Minor Ticks( 0 )}
		),
		Dispatch(
			{},
			"graph title",
			TextEditBox,
			{Set Text( "AVI Yield Exclude dummy vs. In Time (Process before AVI)" )}
		)
	)
);
gb << Bring Window to Front;
//Get the container of the platform
tr = gb << Top Report;
tr << Save Interactive HTML("C:\Users\jmpuser2020c\Desktop\Manufacturing Yield Dashboard\AVI\AVIAutoReport\ProcessBeforeMCAVIYield.html");
/*Close(gb);
Close(dt3);
//set no save for auto taskscheduler
exit(nosave);

/*:
C:\Users\jmpuser2020c\Desktop\Seahawk.jmpC:\Users\jmpuser2020c\Desktop\TTVision.jmpC:\Users\jmpuser2020c\Desktop\Domi3_ITDevice.jmp
r = 555;
r = 0;C:\Users\jmpuser2020c\Desktop\Process_History_LotNoListingBeforeAVI.jmpC:\Users\jmpuser2020c\Desktop\AVIYield (Datasheet).jmp
Interactive HTML: Column "Process Mach No" has an unsupported modeling type.
Interactive HTML: Values excluded by the data filter are not exported.
Interactive HTML: Controls are not interactive.
Interactive HTML: Column "Process Mach No" has an unsupported modeling type.
Interactive HTML: Column "Process Oper" has an unsupported modeling type.
Created Web Page.
- Mark as New
- Bookmark
- Subscribe
- Mute
- Subscribe to RSS Feed
- Get Direct Link
- Report Inappropriate Content
Re: Why my saved Interactive Html (Graph Builder) & Local Filter not interactive?
Hi @WebDesignesCrow ,
Thank you for sharing your log output.
In the lines starting with "Interactive HTML:" I can see that there are two Columns with modeling types that are not supported by Interactive HTML. "Process Mach No" and "Process Oper".
The following lines create these columns by combining other columns:
//combine Mach No with Oven No into "Process Mach No"
dt2 << Combine Columns (
	delimiter(","),
	Columns(
	 :Mach No,
	 :Oven No
	 ),
	Column Name("Process Mach No")
	);
//combine Oper Desc & Cur Oper into "Process Oper"
dt2 << Combine Columns (
	delimiter(","),
	Columns(
	 :Oper Desc,
	 :Cur Oper
	 ),
	Column Name("Process Oper")
	);
The result of Combine Columns is a multiple response column which is the modeling type that is not supported by Interactive HTML.
You can convert the multiple response columns into columns with Data Type = Character and Modeling Type = Nominal, using the Concat transform. I see you have already used this in creating the Local Data Filter:
Transform Column(
					"Concatenate[Process Oper]",
					Character,
					Formula( Concat( :Process Oper ) )
				),
Or, rather than using Combine Columns to make a multiple response columns, you could Concatenate the columns using a comma separator. It would be something like the following:
Transform Column(
				"Process Oper",
				Character,
				Formula( Char( dt2:Oper Desc ) || ", " || dt2:Cur Oper )
			)
In the Formula, you may not need to use the Char() function if the Oper Desc column is already a Character data type and you might need to add it for Cur Oper if the Cur Oper column is not a Character data type.
These are just suggestions. You may be able to find a better way to avoid using the multiple response modeling type for reports you want to export to interactive HTML.
I hope this helps.
~John
- Mark as New
- Bookmark
- Subscribe
- Mute
- Subscribe to RSS Feed
- Get Direct Link
- Report Inappropriate Content
Re: Why my saved Interactive Html (Graph Builder) & Local Filter not interactive?
Hi John,
Thanks for the reply.
Somehow, I still fail to remove the "multiple response modeling type".
I thought the fastest way to remove the "multiple response" is by assigning by using below script;
dt3 = Data Table( "JoinT" );
dt3:Process Mach No << data type(character) <<modeling type(nominal) <<column properties(remove Multiple Response);
dt3:Process Oper << data type(character) <<modeling type(nominal)<<column properties(remove Multiple Response);
I prefer to change the columns' properties after I've combined the tables & columns.
I can remove it manually, but I would like to use script to automate the task of removing the multiple response for both "Process Mach No" & "Process Oper".
Any idea how could I use script to remove the multiple response?

Thanks !
- Mark as New
- Bookmark
- Subscribe
- Mute
- Subscribe to RSS Feed
- Get Direct Link
- Report Inappropriate Content
Re: Why my saved Interactive Html (Graph Builder) & Local Filter not interactive?
I think this will be the one you want.

- Mark as New
- Bookmark
- Subscribe
- Mute
- Subscribe to RSS Feed
- Get Direct Link
- Report Inappropriate Content
Re: Why my saved Interactive Html (Graph Builder) & Local Filter not interactive?
Thanks @Craige_Hales !,
I will try above method as well (as alternative).
For now, I just revisit the whole script and change the earlier scripting during combination of those two columns.
//combine Mach No with Oven No into "Process Mach No"
dt2 << new column ("Process Mach No", character, Formula(:Mach No || :Oven No));
dt2 << new column ("Process Oper", character, "Nominal", Formula( Char( :Cur Oper ) || "_" || :Oper Desc ));
Recommended Articles
- © 2026 JMP Statistical Discovery LLC. All Rights Reserved.
- Terms of Use
- Privacy Statement
- Contact Us