- Don’t miss your chance to experience Discovery Summit Europe at our best available rate! Early bird registration through 31 Oct.
- Graph Builder Toolbar streamlines interactive graphing. Creates shortcuts on Report and GraphBuilder Helpers toolbars. Download and install the extension.
- Subscribe to RSS Feed
- Mark Topic as New
- Mark Topic as Read
- Float this Topic for Current User
- Bookmark
- Subscribe
- Mute
- Printer Friendly Page
Discussions
Solve problems, and share tips and tricks with other JMP users.- User Community
- :
- Discussions
- :
- What does "stack" on Graph Builder actually do?

- Mark as New
- Bookmark
- Subscribe
- Mute
- Subscribe to RSS Feed
- Get Direct Link
- Report Inappropriate Content
What does "stack" on Graph Builder actually do?
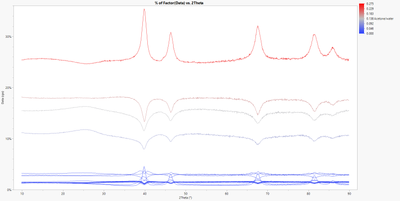
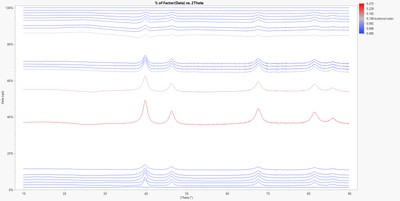
I was playing around with stack on line on graph builder. I assumed it just did some sort of simple offset, but now looking at it, it actually calculates different values. Here are two plots of the same data using the "% of Factor" summary statistic, but one with stack, and the other without. The change is dramatic. What is stack actually doing?
Accepted Solutions


- Mark as New
- Bookmark
- Subscribe
- Mute
- Subscribe to RSS Feed
- Get Direct Link
- Report Inappropriate Content
Re: What does "stack" on Graph Builder actually do?
It is more obvious if you compare it to Area chart
Line no stack

Line stack

Area stacked

Area overlaid

And most likely the useful case for Line and stack is when you also use Fill


- Mark as New
- Bookmark
- Subscribe
- Mute
- Subscribe to RSS Feed
- Get Direct Link
- Report Inappropriate Content
Re: What does "stack" on Graph Builder actually do?
Here is the description of "Stack" taken from the Essential Graphing document found in the JMP Documentation Library

- Mark as New
- Bookmark
- Subscribe
- Mute
- Subscribe to RSS Feed
- Get Direct Link
- Report Inappropriate Content
Re: What does "stack" on Graph Builder actually do?
So I had found the same documentation. But it doesn't answer why some plots look completely different after stacking, and I'm wondering if there are details about what stack actually does behind the scenes. It seems more than a simple offset.
- Mark as New
- Bookmark
- Subscribe
- Mute
- Subscribe to RSS Feed
- Get Direct Link
- Report Inappropriate Content
Re: What does "stack" on Graph Builder actually do?
It is more obvious if you compare it to Area chart
Line no stack
Line stack
Area stacked
Area overlaid
And most likely the useful case for Line and stack is when you also use Fill
Recommended Articles
- © 2026 JMP Statistical Discovery LLC. All Rights Reserved.
- Terms of Use
- Privacy Statement
- Contact Us