- Instantly extract effect sizes, F-ratios, and FDR-adjusted p-values from your models with the Calculate Effects Sizes extension, available now in the JMP Marketplace!
- New to JMP? Join us Sept. 23-24 for the Early User Edition of Discovery Summit, tailor-made for new users. Register now for free!
- See how to use the JMP Marketplace – Free tools to expand JMP capabilities. Register. July 10, 2 pm US Eastern Time.
- Subscribe to RSS Feed
- Mark Topic as New
- Mark Topic as Read
- Float this Topic for Current User
- Bookmark
- Subscribe
- Mute
- Printer Friendly Page
Discussions
Solve problems, and share tips and tricks with other JMP users.- JMP User Community
- :
- Discussions
- :
- Variability in Responses

- Mark as New
- Bookmark
- Subscribe
- Mute
- Subscribe to RSS Feed
- Get Direct Link
- Report Inappropriate Content
Variability in Responses
Hi All,
I am trying to analyze a data set in which 15 doctors all ranked images of a disease on a scale of 0-9. There were 110 images. I want to look at the variability of the doctors/determine how good they are at coming to a similar ranking. Any idea on how to go about this?
Accepted Solutions

- Mark as New
- Bookmark
- Subscribe
- Mute
- Subscribe to RSS Feed
- Get Direct Link
- Report Inappropriate Content
Re: Variability in Responses
The Distribution platform is the 'go to' platform for looking at each response one at a time. Fit Y by X could be very useful for looking across the evaluators. Much can also be done in Graph Builder with things like data filters. All good analysis starts with a clear articulation of the practical problems you would like to address...then find the appropriate analysis methods to answer those questions.

- Mark as New
- Bookmark
- Subscribe
- Mute
- Subscribe to RSS Feed
- Get Direct Link
- Report Inappropriate Content
Re: Variability in Responses
Adding to Peter's advice, you can analyze your data using the Contingency platform. First be sure that the Rating response is set to use the Ordinal modeling type. The Rater data column that identifies the doctor should use the Nominal modeling type. Select Analyze > Fit Y by X. Assign Rating to the Y role and Rater to the X role and click OK. Click the red triangle next to Contingency and select Agreement Statistic. The kappa statistic indicates the strength of the agreement. Kappa close to zero indicates poor agreement and kappa close to one indicates good agreement.
- Mark as New
- Bookmark
- Subscribe
- Mute
- Subscribe to RSS Feed
- Get Direct Link
- Report Inappropriate Content
Re: Variability in Responses
The Distribution platform is the 'go to' platform for looking at each response one at a time. Fit Y by X could be very useful for looking across the evaluators. Much can also be done in Graph Builder with things like data filters. All good analysis starts with a clear articulation of the practical problems you would like to address...then find the appropriate analysis methods to answer those questions.
- Mark as New
- Bookmark
- Subscribe
- Mute
- Subscribe to RSS Feed
- Get Direct Link
- Report Inappropriate Content
Re: Variability in Responses
Adding to Peter's advice, you can analyze your data using the Contingency platform. First be sure that the Rating response is set to use the Ordinal modeling type. The Rater data column that identifies the doctor should use the Nominal modeling type. Select Analyze > Fit Y by X. Assign Rating to the Y role and Rater to the X role and click OK. Click the red triangle next to Contingency and select Agreement Statistic. The kappa statistic indicates the strength of the agreement. Kappa close to zero indicates poor agreement and kappa close to one indicates good agreement.
- Mark as New
- Bookmark
- Subscribe
- Mute
- Subscribe to RSS Feed
- Get Direct Link
- Report Inappropriate Content
Re: Variability in Responses
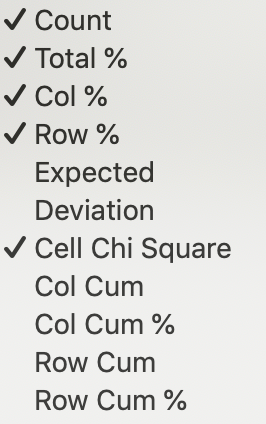
Thanks for the advice! So I was able to get contingency tables, but do not see agreement statistics. I posted a file of the two options that come up when clicking the red triangle. One is for the red triangle for contingency analysis, and one is for contigency table.


Hope i'm not being confusing! I appreciate the help i've received.
- Mark as New
- Bookmark
- Subscribe
- Mute
- Subscribe to RSS Feed
- Get Direct Link
- Report Inappropriate Content
Re: Variability in Responses
Nevermind. For some reason, when I ran it again, it worked as you said. Thanks!
Recommended Articles
- © 2026 JMP Statistical Discovery LLC. All Rights Reserved.
- Terms of Use
- Privacy Statement
- Contact Us