- Mark as New
- Bookmark
- Subscribe
- Mute
- Subscribe to RSS Feed
- Get Direct Link
- Report Inappropriate Content
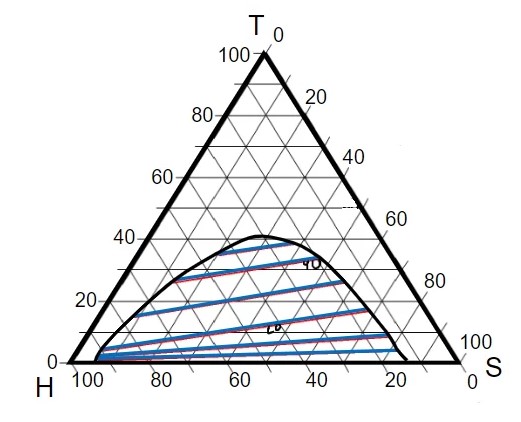
Ternary Plots with Tie Lines

Hi all,
I am trying to build a three liquid equilibrium diagram with tie-lines. I am able to get my data for the phase envelope but cannot figure out how to add the tie lines.
I am using Windows JMP16.20.
Thanks!
1 REPLY 1

Staff
- Mark as New
- Bookmark
- Subscribe
- Mute
- Subscribe to RSS Feed
- Get Direct Link
- Report Inappropriate Content
Re: Ternary Plots with Tie Lines
You need to have a formula column with a model that describes the "tie lines" or contours, as they would be called in JMP. See the attached example.
Graph > Mixture Profiler. Add your formula column in Y, Prediction Formula and click ok. Then look in the Mixture Profiler red triangle menu for the various options to define the contours and other aspects of the appearance.
I hope this helps,
Phil
