- Don’t miss your chance to experience Discovery Summit Europe at our best available rate! Early bird registration through 31 Oct.
- Graph Builder Toolbar streamlines interactive graphing. Creates shortcuts on Report and GraphBuilder Helpers toolbars. Download and install the extension.
- Subscribe to RSS Feed
- Mark Topic as New
- Mark Topic as Read
- Float this Topic for Current User
- Bookmark
- Subscribe
- Mute
- Printer Friendly Page
Discussions
Solve problems, and share tips and tricks with other JMP users.- User Community
- :
- Discussions
- :
- Re: Swap X and Y axis in Variability Chart

- Mark as New
- Bookmark
- Subscribe
- Mute
- Subscribe to RSS Feed
- Get Direct Link
- Report Inappropriate Content
Swap X and Y axis in Variability Chart
Hi,
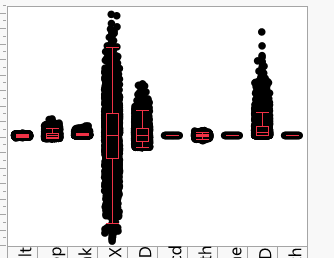
The names of my x-axis variables show up vertically aligned.
I would not want to use 'rotated tick options'. Because this increases the horizontal dimension of the chart in an undesired way.
Instead if I can swap the X and Y axis, then the input variable names will become reader-friendly, without increasing the size of the chart :)
Please refer the image. Sorry, I had to crop the image to avoid publishing company data on public platform.
Thanks,
Kishore
Kishore
Accepted Solutions


- Mark as New
- Bookmark
- Subscribe
- Mute
- Subscribe to RSS Feed
- Get Direct Link
- Report Inappropriate Content
Re: Swap X and Y axis in Variability Chart
Hello,
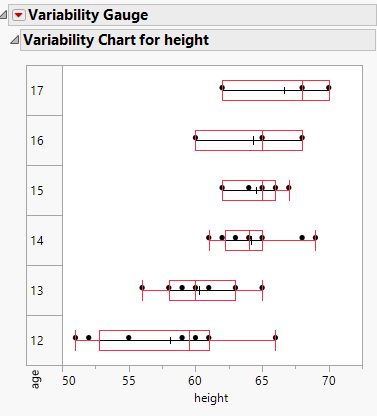
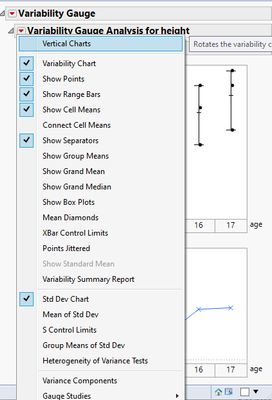
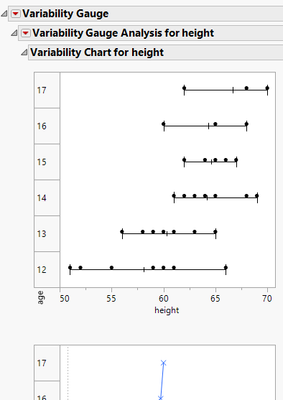
I am not sure if this is what you're looking for or not, but you can select Vertical Charts within the Variability platform to swap the axes.
Thanks.
Laura


- Mark as New
- Bookmark
- Subscribe
- Mute
- Subscribe to RSS Feed
- Get Direct Link
- Report Inappropriate Content
Re: Swap X and Y axis in Variability Chart
Use @Laura_Lancaster solution below...not my suggestion
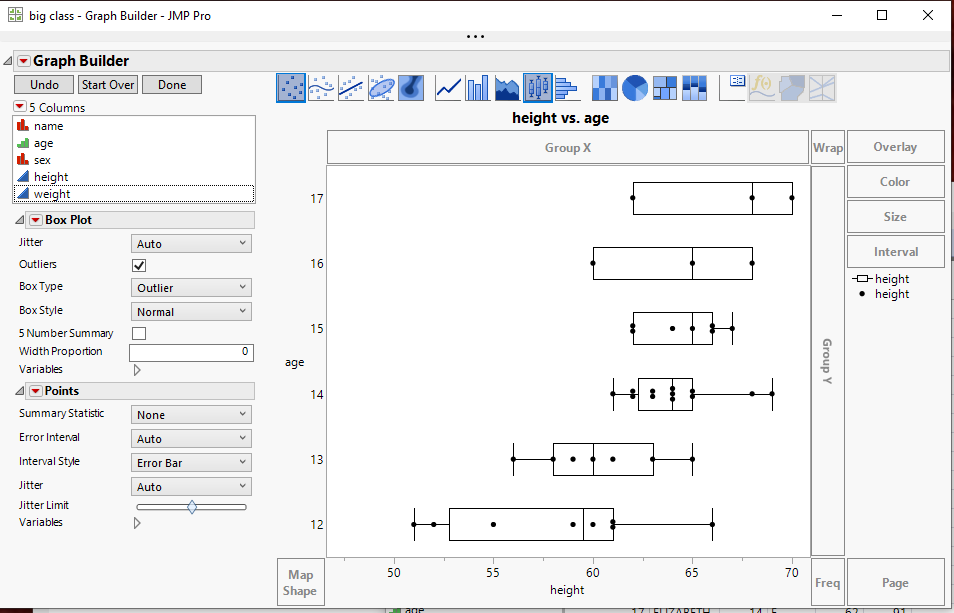
It looks like you could just use Graph Builder and put he axes the way you want them
- Mark as New
- Bookmark
- Subscribe
- Mute
- Subscribe to RSS Feed
- Get Direct Link
- Report Inappropriate Content
Re: Swap X and Y axis in Variability Chart
Hello,
I am not sure if this is what you're looking for or not, but you can select Vertical Charts within the Variability platform to swap the axes.
Thanks.
Laura
- Mark as New
- Bookmark
- Subscribe
- Mute
- Subscribe to RSS Feed
- Get Direct Link
- Report Inappropriate Content
Re: Swap X and Y axis in Variability Chart
- Mark as New
- Bookmark
- Subscribe
- Mute
- Subscribe to RSS Feed
- Get Direct Link
- Report Inappropriate Content
Re: Swap X and Y axis in Variability Chart
Regards,
Kishore
Kishore

- Mark as New
- Bookmark
- Subscribe
- Mute
- Subscribe to RSS Feed
- Get Direct Link
- Report Inappropriate Content
Re: Swap X and Y axis in Variability Chart
Hello Laura,
I am new with jump and having same issue. Could you kindly show a detail how to do this?
Thanks,
Khanh
- Mark as New
- Bookmark
- Subscribe
- Mute
- Subscribe to RSS Feed
- Get Direct Link
- Report Inappropriate Content
Re: Swap X and Y axis in Variability Chart
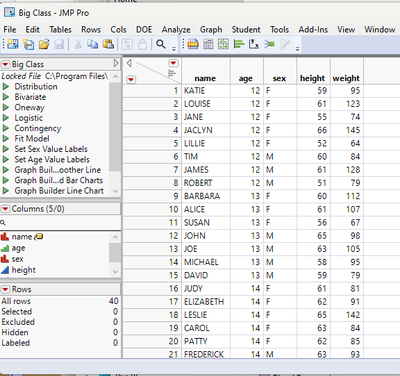
Open your data table. In Laura's example she used the Big Class data table from the Sample Data Folder available under the Help pull down menu.
Go to
Analyze=>Quality and Process=> Variability // Attribute Control Chart
In the dialog window that is displayed, select column height for the Y, Response and column age for the X, Grouping and click on OK.
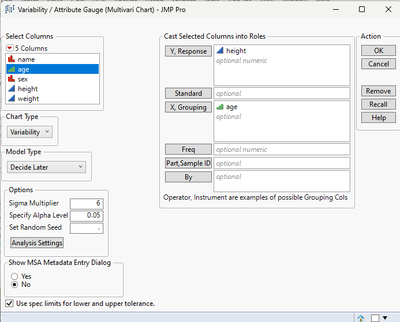
The Output Display window will appear
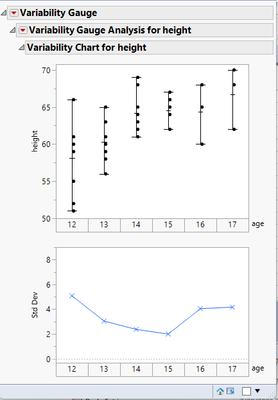
Click on the red triangle to the left of the title for the outline box titled "Variability Guage Analysis for height" and select "Vertical Charts"
The display will change to a Vertical form
Recommended Articles
- © 2026 JMP Statistical Discovery LLC. All Rights Reserved.
- Terms of Use
- Privacy Statement
- Contact Us