- Don’t miss your chance to experience Discovery Summit Europe at our best available rate! Early bird registration through 31 Oct.
- Image to Table JMP extension imports single or batch images as data tables. Useful to extract curves from pictures or convert image data to curve data to use in analyses like Functional Data Explorer. Download and install the extension.
- Subscribe to RSS Feed
- Mark Topic as New
- Mark Topic as Read
- Float this Topic for Current User
- Bookmark
- Subscribe
- Mute
- Printer Friendly Page
Discussions
Solve problems, and share tips and tricks with other JMP users.- User Community
- :
- Discussions
- :
- Spline Fit Line Legend

- Mark as New
- Bookmark
- Subscribe
- Mute
- Subscribe to RSS Feed
- Get Direct Link
- Report Inappropriate Content
Spline Fit Line Legend
Hi all,
I am trying to create bivariate plots with a fit spline. However, I am trying to get the line legends but with no success. How can I get and save the line legend? Please help
Here's my function
bivplot_mrw = Function({ ycol }, {plot},

						biv = Bivariate( Y( Column(dt, ycol) ), X( Column( dt, mrwname ) ), Group By( Column( dt, grpname2 ) ),
										 Fit Spline( 1000 ) );

						rbiv = biv << report << Show Points( 0 );

						ylist = {};

						For(g2 = 1, g2 <= Nitems(grplist2[1]), g2++,
							Try(
							curvename = rbiv[Outline Box( g2 + 1 )] << Get Title;

							//Compute max and min per spline fit line to get y-axis max and min
							current_row = storows2[ Contains( stolist2, grplist2[3][g2] ) ];	//Get the stolist rows for grplist2[g2]
							current_row << Intersect( grprows[ Contains( grplist, grplist2[2][g2] ) ]);
							current_row = Matrix( current_row << Get Keys );
							xin = Column( dt, mrwname)[current_row];
							yin = Column( dt, ycol)[current_row];
							Try(ypred = Spline Eval( xin, Spline Coef( xin, yin, 1000 ) ));
							ylist = Concat(ylist, As List(ypred));

							//Adjust also the line style
							If(
								Contains( curvename, linestyle["ddd"] ),
									biv << (Curve[g2] << Line Style( DashDotDot )),
								Contains( curvename, linestyle["dash"] ),
									biv << (Curve[g2] << Line Style( Dashed ))
								);
							));

						Try( paxis = axiscalc( Min(ylist), Max(ylist) ), Show("axiscalc error for "||ycol) );
						Try( xaxis = axiscalc( mrwmin, mrwmax ), Show("axiscalc error for MRW") );

						rbiv[Frame Box( 1 )] << {Frame Size( 205, 164 ), Marker Size( 1 ), Line Width Scale( 2 )};

						Try( rbiv[Axis Box( 1 )] << Max( paxis["Max"] ) << Min( paxis["Min"] ) << Inc( paxis["Inc"] ) << Minor Ticks( paxis["Ntick"] ) );
						Try( rbiv[Axis Box( 2 )] << Max( xaxis["Max"] ) << Min( xaxis["Min"] ) << Inc( xaxis["Inc"] ) << Minor Ticks( xaxis["Ntick"] ) );

						rbiv[Axis Box( 1 )] << Format( "Best", 12 ) << Tick Font( style( 1 ), size( 9 ) )
											<< Show Major Grid( 1 ) << Show Minor Grid( 1 ) << Show Minor Ticks( 1 );

						rbiv[Axis Box( 2 )] << Format( "Best", 12 ) << Tick Font( style( 1 ), size( 9 ) )
											<< Show Major Grid( 1 ) << Show Minor Grid( 1 ) << Show Minor Ticks( 1 );

						rbiv[Text Edit Box( 1 )] << Set Font Size( 10 ) <<	Set Font Style( "Bold" );
						rbiv[Text Edit Box( 2 )] << Set Font Size( 10 ) <<	Set Font Style( "Bold" );
						(rbiv << xpath( "//OutlineBox" )) << Close;
						rbiv[Outline Box( 1 )] << Set Title( ycol );
						rbiv[Border Box( 2 )] << Delete Box;

						rbiv[Outline Box( 1 )] << Open All Like This;

					);
Accepted Solutions

- Mark as New
- Bookmark
- Subscribe
- Mute
- Subscribe to RSS Feed
- Get Direct Link
- Report Inappropriate Content
Re: Spline Fit Line Legend
Does this help?
NamesDefaultToHere(1);

dt = Open("$SAMPLE_DATA/Big Class.jmp");

biv = dt << Bivariate(
				Y( :weight ),
				X( :height ),
				Show Points( 0 ),
				Fit Where( :sex == "F", Fit Spline( 1000, {Line Color( {212, 73, 88} )} ) ),
				Fit Where( :sex == "M", Fit Spline( 1000, {Line Color( {66, 112, 221} )} ) ),
				SendToReport(
					Dispatch(
						{},
						"Bivar Plot",
						FrameBox,
						{Grid Line Order( 1 ), Reference Line Order( 2 )}
					)
				)
			);

bivRep = Report(biv);
pb2Pic = bivRep[PictureBox(2)] << getPicture(Scale(1.5));
nw = New Window("Example", pb2Pic);- Mark as New
- Bookmark
- Subscribe
- Mute
- Subscribe to RSS Feed
- Get Direct Link
- Report Inappropriate Content
Re: Spline Fit Line Legend
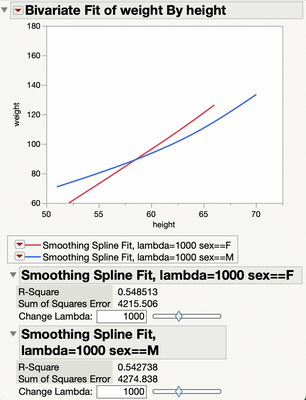
I'm not quite sure what you mean by 'get the line legends'. Using the example below, could you be a little more specific about what information you want to get from the report, please?
- Mark as New
- Bookmark
- Subscribe
- Mute
- Subscribe to RSS Feed
- Get Direct Link
- Report Inappropriate Content
Re: Spline Fit Line Legend
Hi ian_jmp, I wanted to save/get the line legend as an image so I can use it on other slides in my powerpoint
- Mark as New
- Bookmark
- Subscribe
- Mute
- Subscribe to RSS Feed
- Get Direct Link
- Report Inappropriate Content
Re: Spline Fit Line Legend
Does this help?
NamesDefaultToHere(1);

dt = Open("$SAMPLE_DATA/Big Class.jmp");

biv = dt << Bivariate(
				Y( :weight ),
				X( :height ),
				Show Points( 0 ),
				Fit Where( :sex == "F", Fit Spline( 1000, {Line Color( {212, 73, 88} )} ) ),
				Fit Where( :sex == "M", Fit Spline( 1000, {Line Color( {66, 112, 221} )} ) ),
				SendToReport(
					Dispatch(
						{},
						"Bivar Plot",
						FrameBox,
						{Grid Line Order( 1 ), Reference Line Order( 2 )}
					)
				)
			);

bivRep = Report(biv);
pb2Pic = bivRep[PictureBox(2)] << getPicture(Scale(1.5));
nw = New Window("Example", pb2Pic);

- Mark as New
- Bookmark
- Subscribe
- Mute
- Subscribe to RSS Feed
- Get Direct Link
- Report Inappropriate Content
Re: Spline Fit Line Legend
Like @ian_jmp, I am not sure what you are asking either, but here is a simple example to illustrate the syntax to access the commands in the red triangle menu for each fit:
Names Default to Here( 1 );

dt = Open( "$SAMPLE_DATA/Big Class.jmp" );

biv = dt << Bivariate(
	Y( :weight ),
	X( :height ),
	Fit Spline( 10 )
);

biv << (Curve[1] << Line Color( "Green" ) );- Mark as New
- Bookmark
- Subscribe
- Mute
- Subscribe to RSS Feed
- Get Direct Link
- Report Inappropriate Content
Re: Spline Fit Line Legend
HI markbailey, I just need to have the line legends saved as an image so that I can use it on several slides in my powerpoint.
Recommended Articles
- © 2026 JMP Statistical Discovery LLC. All Rights Reserved.
- Terms of Use
- Privacy Statement
- Contact Us