- Subscribe to RSS Feed
- Mark Topic as New
- Mark Topic as Read
- Float this Topic for Current User
- Bookmark
- Subscribe
- Mute
- Printer Friendly Page
Discussions
Solve problems, and share tips and tricks with other JMP users.- JMP User Community
- :
- Discussions
- :
- Re: Remove non labels from hovering information
- Mark as New
- Bookmark
- Subscribe
- Mute
- Subscribe to RSS Feed
- Get Direct Link
- Report Inappropriate Content
Remove non labels from hovering information
Hi All,
I was wondering if the is a way to define that coordinates will not be shown when hovering the cursor over points?
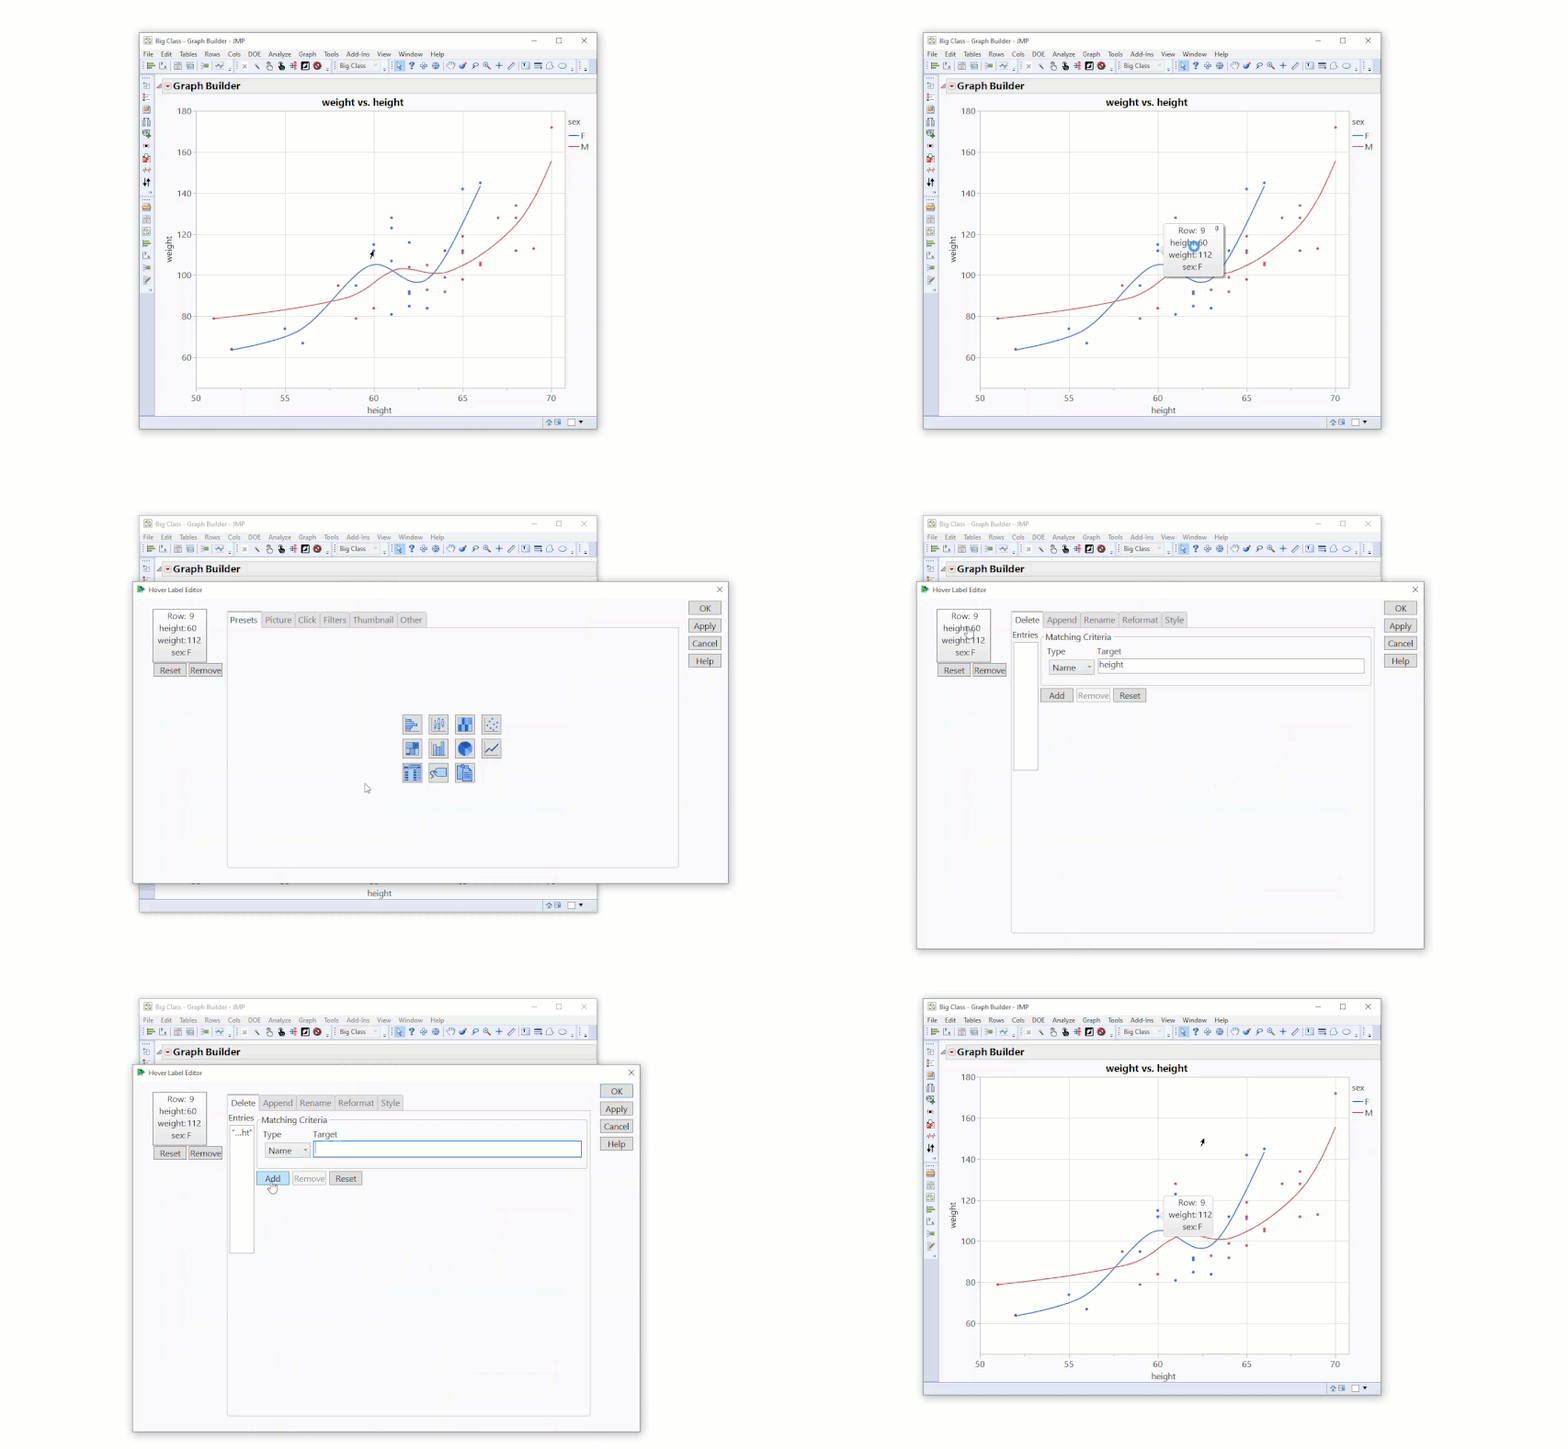
By default, when hovering the cursor over a point in any graph, the label is given together with the coordinates. I would like only the labels to be shown. In the example picture, I would like not to see the height and weight but just the name.
Thank you!
- Mark as New
- Bookmark
- Subscribe
- Mute
- Subscribe to RSS Feed
- Get Direct Link
- Report Inappropriate Content
Re: Remove non labels from hovering information
If the graph contains subplots via Wrap, Group Y or Group X, the Hover Label Editor even allows to define for each subplot different values to be added or removed from the respective hover labels.
On the other hand:
Is there also a possibility to define the same setting for all subplots at once, like a checkbox in Hover Label Editor: apply to all plots?
Or is the only way to code it in JSL?
Open( "$SAMPLE_DATA/Airline Delays.jmp" );

gb = Graph Builder(
	Size( 528, 485 ),
	Show Control Panel( 0 ),
	Graph Spacing( 5 ),
	Variables(
		X( :Day of Month ),
		Y( :Day of Week ),
		Wrap( :Airline ),
		Color( :Arrival Delay )
	),
	Elements( Heatmap( X, Y, Legend( 9 ) ) )
);

frameboxes=Report(gb)<< xpath( "//FrameBox" )

for each ({fb,idx},frameboxes, fb <<Set Gridlet( Expunge( {{Matcher( "Day of Week" )}} ) ))
- Mark as New
- Bookmark
- Subscribe
- Mute
- Subscribe to RSS Feed
- Get Direct Link
- Report Inappropriate Content
Re: Remove non labels from hovering information
Ah:
If the user presses CTRL at the moment he clicks on HoverLabel/Paste Graphlet, the code is applied to every single Framebox.
I knew this trick to apply synchronous changes to report structures, but did not know that it works as well for functions in the Graph Builder right click menu.
cool!
Just try: CTRL + Graph/Background Color ...
- Mark as New
- Bookmark
- Subscribe
- Mute
- Subscribe to RSS Feed
- Get Direct Link
- Report Inappropriate Content
Re: Remove non labels from hovering information
hi @nascif_jmp ,
@nascif_jmp wrote:You can even delete all entries and then use the Append operator to add any content you want
Cool!
Up to now I fiddled around by copying individual column names to remove them step by step - I always missed a drop-down menu which gives me the chance to pick a column instead of typing it in.
Actually, it will be much easier to remove all of them and just add the ones that I need.
What is the easiest way to do so?
Can I use wildcards - or ranges for the index?
- Mark as New
- Bookmark
- Subscribe
- Mute
- Subscribe to RSS Feed
- Get Direct Link
- Report Inappropriate Content
Re: Remove non labels from hovering information
Or anybody else?
Where do I have to click to delete all entries?
[as @nascif_jmp wrote in his post]
- Mark as New
- Bookmark
- Subscribe
- Mute
- Subscribe to RSS Feed
- Get Direct Link
- Report Inappropriate Content
Re: Remove non labels from hovering information
I found a quite convenient way: Instead of opening the Hover Label Editor,
place the mouse over a data point to open a Hover Label - then right-click on the hover label and click on edit
In the menu, there is a preview Hover Label visible on the left where you can click on entries and remove them:
https://community.jmp.com/t5/JMP-Wish-List/To-modify-hover-label-editor-so-it-is-more-user-friendly/...
(also explained in Jmp Documentation Library/Using Jmp/Jmp Reports)
- « Previous
-
- 1
- 2
- Next »
Recommended Articles
- © 2026 JMP Statistical Discovery LLC. All Rights Reserved.
- Terms of Use
- Privacy Statement
- Contact Us


